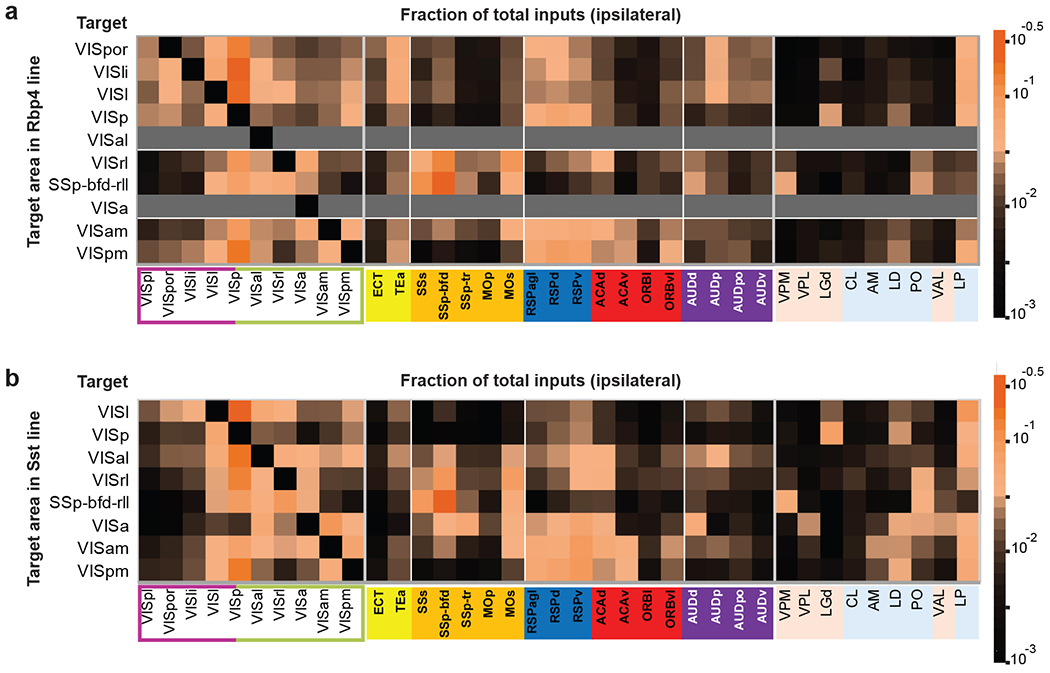
Extended Data Figure 5. Connectivity matrices comparing the inputs to Rbp4 (a) and Sst (b) neurons in the visual areas from within the visual cortex, non-visual isocortical modules, and thalamus.

Gray indicates experiments not available. In the matrix, each row represents experiments with the same target area, and each cell shows the fraction of the total inputs in a given input structure measured from a single experiment or the average when n > 1.
