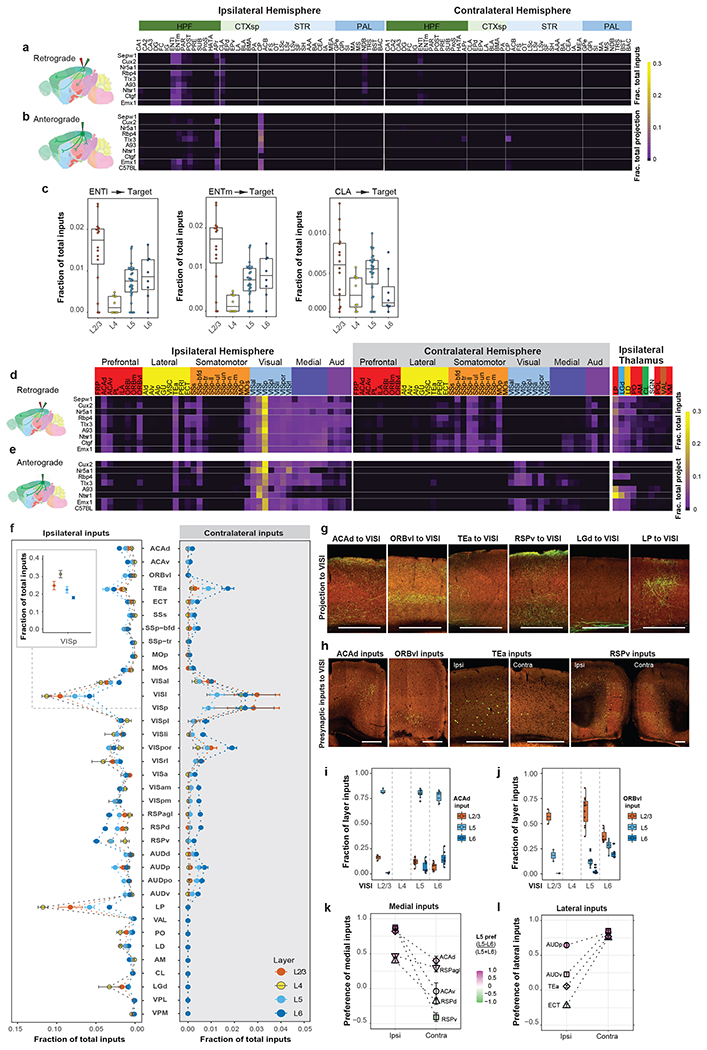
Extended Data Figure 7. Comparison of subcortical inputs to excitatory neurons in different layers of VISp and brain-wide input patterns to excitatory neuron subclasses in VISl.

(a) Connectivity matrix showing presynaptic inputs from the ipsilateral and contralateral HPF, CTXsp, STR, and PAL to excitatory neurons in different layers of VISp. Each row of the matrix represents the mean per structure fraction of total input signals for experiments in each Cre line. Rows are organized based on layer-specific distribution of the starter cells. Brain regions are ordered by ontology order in the Allen CCFv3. (b) Connectivity matrix showing normalized projections from VISp to the brain regions shown in (a). Anterograde tracing experiments (Supplementary Table 4) from the Cre mouse lines used in (a) and C57BL/6J were included, and rows represent the mean per structure fraction of total projection signals for experiments in each mouse line. (c) Comparison of ENTl, ENTm, and CLA inputs to excitatory neurons in different layers of VISp. Box plots show median and interquartile range (IQR). Whiskers show the largest or smallest value no further than 1.5 × IQR from the hinge (same below). The numbers of independent experiments are as follows: L2/3: n=16; L4: n=10; L5: n=29; L6: n=7. (d) Connectivity matrix showing normalized inputs from the ipsilateral and contralateral isocortex, and ipsilateral thalamus to excitatory neurons in different layers of VISl. Each row of the matrix represents the mean per structure fraction of total input signals for experiments in each Cre line. Rows are organized based on layer-specific distribution of the starter cells. The cortical areas are ordered first by module membership (color coded) then by ontology order in the Allen CCFv3. The ten thalamic nuclei are ordered based on the strength of inputs, and are color coded by the thalamocortical projection classes (blue: core, green: intralaminar, brown: matrix-focal, and red: matrix-multiareal). (e) Connectivity matrix showing normalized axon projections from VISl to the ipsilateral and contralateral isocortex, and ipsilateral thalamus shown in (d). Anterograde tracing experiments (Supplementary Table 5) from the Cre mouse lines used in (d) and C57BL/6J were included, and rows represent the mean per structure fraction of total projection signals for experiments in each mouse line. (f) Comparison of inputs from ipsilateral and contralateral cortical areas and thalamic nuclei to excitatory neurons in different layers of VISl. The inset shows fraction of inputs from VISp to excitatory neurons in different layers of VISl. Data are shown as mean ± s.e.m. The numbers of independent experiments are as follows: L2/3: n=5; L4: n=4; L5: n=11; L6: n=8. (g-h) Representative STPT images showing laminar termination patterns of axon projections in VISl from higher-order association cortical areas and thalamic nuclei (g) and laminar distribution patterns of presynaptic input cells in the cortical areas that project to VISl (h). Ipsi, ipsilateral hemisphere. Contra, contralateral hemisphere. (i-j) Quantification of laminar distribution of inputs from ACAd (i, numbers of independent experiments: L2/3: n=3; L5: n=10; L6: n=7) and ORBvl (j, numbers of independent experiments: L2/3: n=2; L5: n=11; L6: n=7) to excitatory neurons in different layers of VISl. The fraction of layer inputs is calculated as the fraction of the total input signals in a given source area across layers. (k-l) Comparison of L5 and L6 preference for medial (k) or lateral (l) source cortical areas in the ipsilateral and contralateral hemispheres sending presynaptic inputs to VISl. The preference score for a given cortical area is calculated as (L5 input - L6 input) / (L5 input + L6 input). Each source cortical area was colored according to its preference score. Data are shown as mean ± s.e.m. The numbers of independent experiments included are as follows: ACAd (Ipsi): n=35; ACAv (Ipsi): n=26; RSPd (Ipsi): n=40; RSPv (Ipsi): n=43, RSPagl (Ipsi): n=36, AUDp (Ipsi): n=39, AUDv (Ipsi): n=30; TEa (Ipsi): n=42, ECT (Ipsi): n=30, ACAd (Contra): n=8; ACAv (Contra): n=4; RSPd (Contra): n=14; RSPv (Contra): n=10, RSPagl (Contra): n=13, AUDp (Contra): n=17, AUDv (Contra): n=13; TEa (Contra): n=26, ECT (Contra): n=14. Scale bars, 500 μm. We also find generally consistent input patterns to excitatory neurons in different layers of other HVAs as of VISp and VISl, though due to smaller number of experiments in each layer of each region (Figure 2a) we do not provide quantitative analysis here.
