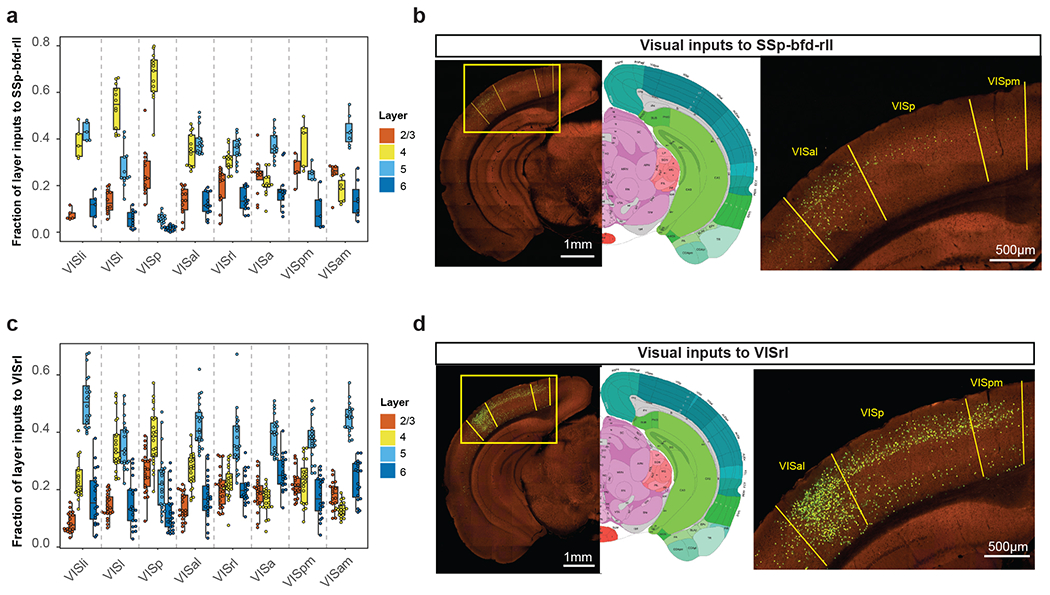
Extended Data Figure 10. Comparison of laminar distribution of visual inputs to SSp-bfd-rll (a-b) and VISrl (c-d).

(a, c) Laminar distribution of inputs from various visual areas to SSp-bfd-rll (a, the numbers of independent experiments are: VISli and VISpm: n=5, VISl and VISa: n=12; VISp, VISal, and VISrl: n=13; VISam: n=7) and VISrl (c, the numbers of independent experiments are: VISli and VISpm: n=20, VISl and VISa: n=21; VISp: n=23; VISal and VISrl: n=22; VISam: n=19). Box plots show median and interquartile range (IQR). Whiskers show the largest or smallest value no further than 1.5 × IQR from the hinge. (b, d) Representative images of inputs from VISp, VISpm and VISal to SSp-bfd-rll (b) and VISrl (d).
