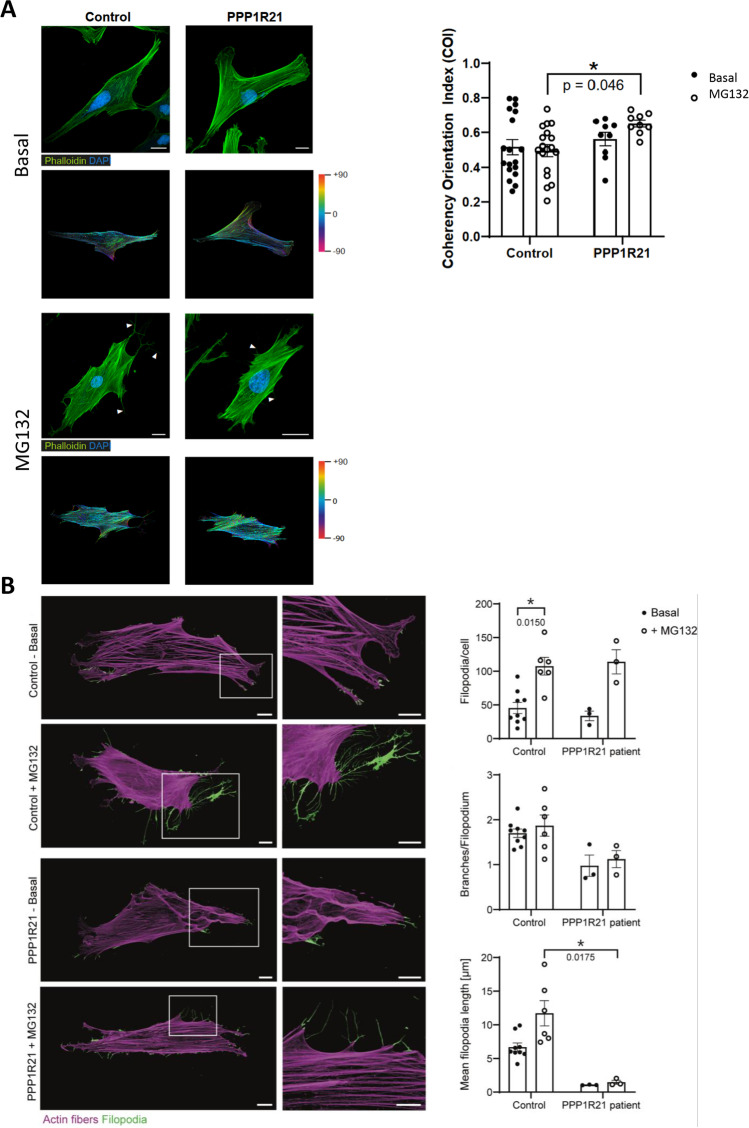
Fig. 6.
Studies of actin cytoskeleton. A Actin filaments (Phalloidin, green) and nuclei (DAPI, blue) of control and PPP1R21 patient-derived fibroblasts are visualized via confocal laser scanning microscopy. MG132 treated fibroblasts of control patients exhibit longer and more branched filopodia (white arrows) than PPP1R21 patient fibroblasts. Scale bars: 20 µm. Circular color map coding displays the local actin filament orientation of the basal and MG132 treated fibroblasts derived from controls and the PPP1R21 patient, respectively. The color gradient indicates the spatial orientation of the actin fibers from − 90° to + 90°. MG132 treatment induced a significant increase in the cytoskeletal coherency of PPP1R21 patient fibroblasts compared to stimulated controls. B Microscopic studies of fibroblast filopodia (illustrated in green) revealed an effect of MG132 exposure in terms of an increase of filopodia formation per cell in both, control- and patient-derived cells. Branches and length per filopodia are (slightly) reduced in patient-derived cells and. Mean filopodia length increased upon MG132 treatment only in control fibroblasts. Scale bars in overview images = 20 µm, scale bars in magnification = 10 µm

