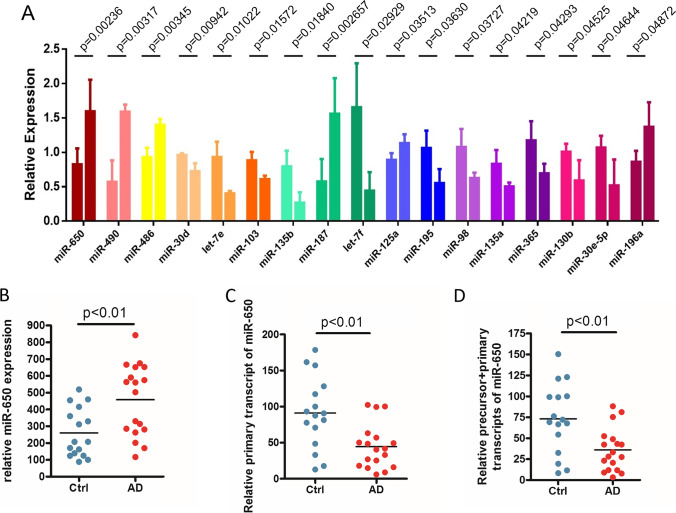
Fig. 1.
Identification of significantly altered miRNAs in brain from AD patients. A Relative expression levels of top 17 miRNAs from control and Alzheimer’s disease (AD) subjects. For each miRNA, left column represents the control and the right column represents the AD. Unpaired t-test, p-value showed on the top of each group. B–D Relative expression levels of matured miR-650 (B), primary miR-650 (C), and precursor and primary transcript of miR-650 (D) for control and AD subjects. Unpaired t-test, p < 0.01. Control, n = 16; AD, n = 18

