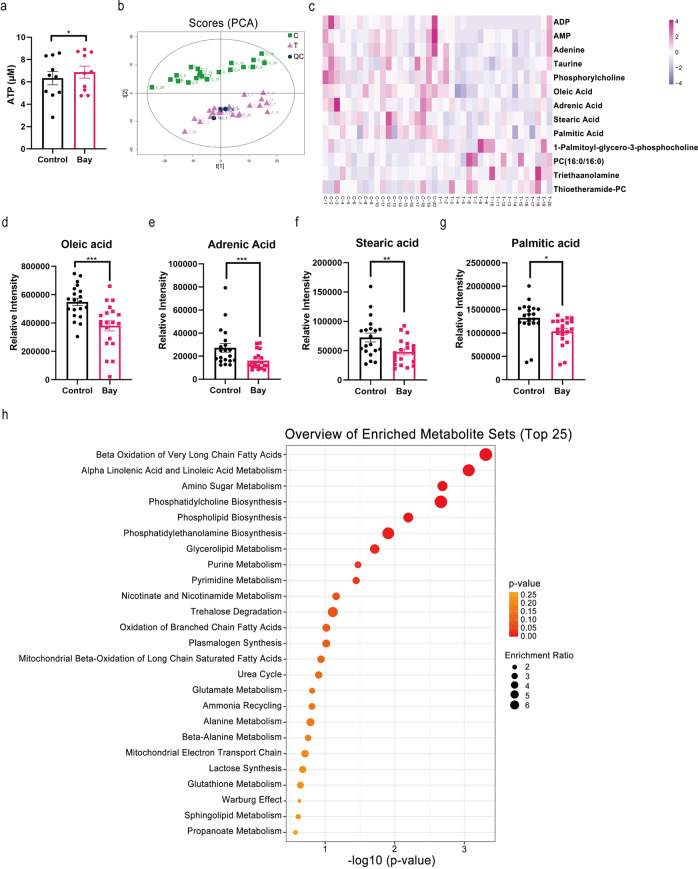
Fig. 4. Bay117082-induced sperm motility enhancement consumes fatty acids as the energy source.
a Effects of 25 μM Bay117082 on sperm ATP level. Values represent mean ± SEM (n = 10), *p < 0.05, as compared with the control (0 μM). b Principal component (PCA) analysis of untargeted metabolomics data obtained from Bay117082-treated sperm and control sperm. Each dot on plot represents an individual sample (n = 20). Green dots represented the control group (C); purple dots represent the Bay117082-treated group (T); blue dots represent the quality control samples. c Heatmap of significantly different metabolites in the control (C) and Bay117082-treated (T) group. The variable importance in the projection (VIP) value of each variable in the orthogonal partial least squares discriminant analysis (OPLS-DA) model was calculated. Significance was determined using paired Student’s t test. VIP > 1 and p < 0.05 were applied to identify statistically significant differential metabolites. The x-axis represents comparative changes in each sperm sample before (C1–C20) and after (T1–T20) Bay117082 treatment. Significantly different metabolites were labeled on the y-axis. d–g Bay117082-induced changes in oleic acid (d), adrenic acid (e), stearic acid (f), and palmitic acid (g) in sperm. Values represent mean ± SEM (n = 20), *p < 0.05; **p < 0.01; ***p < 0.001, as compared with the control (0 μM). h Metabolite Set Enrichment Analysis based on the Small Molecule Pathway Database. The top 25 of enriched pathways are shown.

