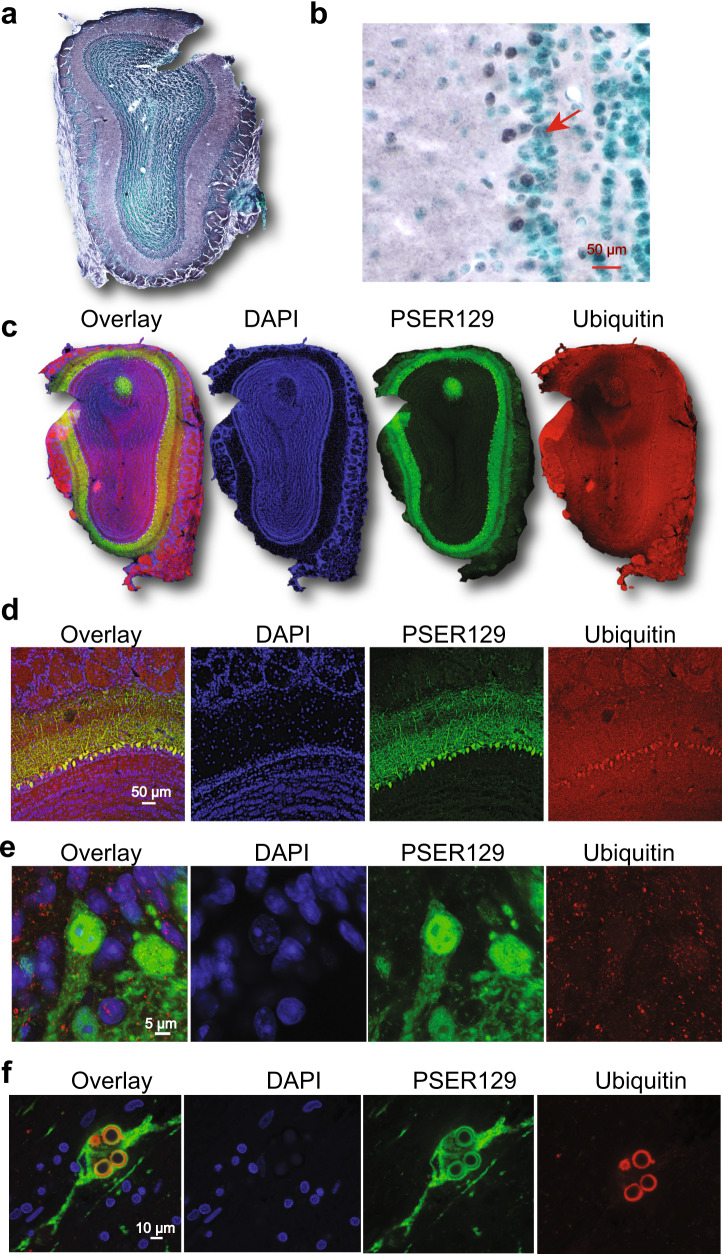
Fig. 5. PSER129 is not associated with ubiquitin in OB mitral cells.
Ubiquitin levels and distribution in the mouse OB were determined. a Low magnification image showing ubiquitin staining in the main OB. b High-magnification image showing ubiquitin staining in the mitral cell layer. The red arrow denotes ubiquitin-positive cells in the mitral cell layer. c Low magnification images of OB sections fluorescently labeled for PSER129 and ubiquitin. d High-resolution confocal images showing the distribution of ubiquitin in the mitral cell layer. e Confocal image of single PSER129 positive mitral cell. f Substantia nigra from PD brain fluorescently labeled for ubiquitin and PSER129 using the same TSA multiplex approach. All sections were counterstained with either methyl green or DAPI (WT mice n = 3, PD substantia nigra n = 3).

