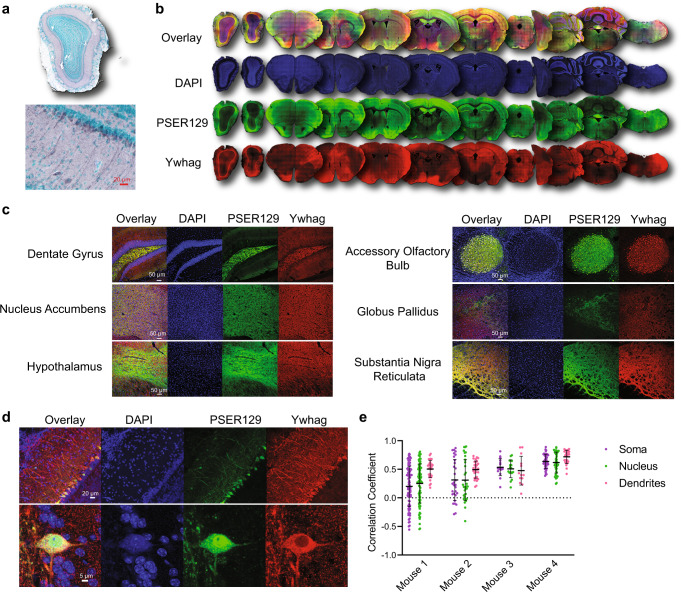
Fig. 7. BAR-PSER129 identified protein Ywhag associated with PSER129 across the neuroaxis.
a IHC detection of Ywhag in the WT mouse OB. b Whole section scans of dual-labeled Ywhag and PSER129 across the neuroaxis of a healthy mouse. c High-magnification confocal images of Ywhag and PSER129 in select brain regions. d High-magnification confocal images of Ywhag and PSER129 in the mitral cell layer. e Colocalization analysis of mitral cells. Pearson’s correlation coefficient was calculated in the soma, nucleus, and dendrites of PSER129 positive mitral cells. (mean ± SD, WT mice, n = 4).

