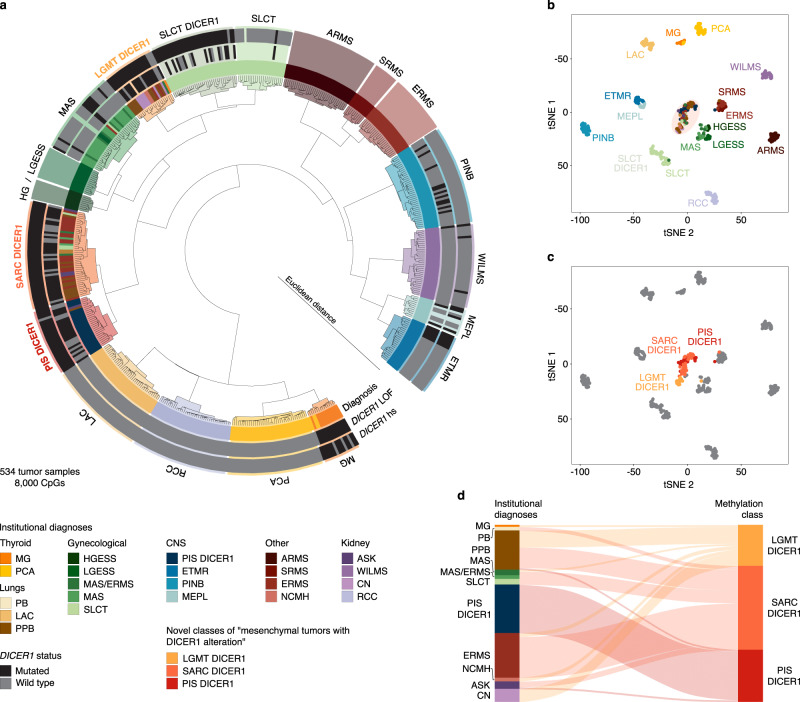
Fig. 1. Molecular classification of DICER1-associated neoplasms by DNA methylation analysis.
a Unsupervised hierarchical clustering (Euclidean ward) of the 8000 most differentially methylated CpGs of 534 neoplasms (related to Supplementary Fig. 1a). Samples are colored according to their institutional diagnoses. Known DICER1 variants are denoted in black, DICER1 wild-type alleles are indicated in dark-gray, blank annotation indicates unknown DICER1 status. Clusters are colored according to their molecular class by DNA methylation. b, c 2D representation of pairwise sample correlation using the 8000 most variable methylated probes by t-SNE dimensionality reduction (related to Supplementary Fig. 1b, c). b Samples are colored according to their institutional diagnoses. c Samples are colored according to their cluster assignment of LGMT DICER1, SARC DICER1 and PIS DICER1 by unsupervised hierarchical clustering (a). Tumors falling into other clusters are depicted in gray. d Reclassification of neoplasms into three molecular classes of mesenchymal neoplasms with DICER1 alteration (LGMT DICER1, SARC DICER1 and PIS DICER1) corresponding to their institutional diagnoses. Institutional diagnoses and methylation clusters are depicted by colors as indicated.

