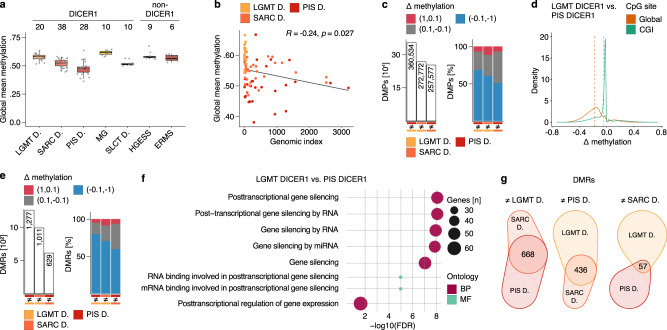
Fig. 4. Sarcomas with DICER1 alteration show a genome-wide hypomethylation signature.
a Global mean DNA methylation levels per sample across CpGs outside of CGIs (CpG-dense regions in CGIs are excluded for global quantifications) for LGMT DICER1, SARC DICER1 and PIS DICER1, MG and SLCT DICER1, as well as ERMS and HGESS (Supplementary Table 4). Black lines mark the median, edges of boxes denote interquartile range (IQR), and vertical lines indicate 1.5 × IQR. Number of samples analyzed, and DICER1-association are indicated at the top. b Global mean methylation and genomic index show an inverse correlation in LGMT DICER1, SARC DICER1 and PIS DICER1. Correlation was determined using the Pearson correlation coefficient. c Absolute number, and difference (Δ) in methylation of differentially methylated probes (DMPs) identified in a group-wise comparison of clusters of mesenchymal neoplasms with DICER1 alteration (LGMT DICER1, SARC DICER1 and PIS DICER1) (Supplementary Table 5). Δ in methylation indicates the difference between individual beta values: Red indicates a positive Δ in methylation of 1 to 0.1 (hypermethylation), gray indicates a Δ in methylation between 0.1 and −0.1, and blue indicates a negative Δ in methylation of −0.1 to −1 (hypomethylation). d Difference (Δ) in methylation according to genome-wide distribution of DMPs identified in a group-wise comparisons between LGMT DICER1 and PIS DICER1 (related to Supplementary Fig. 5f, g). Dashed lines mark the mean difference in methylation according to genome-wide distribution of DMPs. e Absolute numbers, and difference (Δ) in methylation of differentially methylated regions (DMRs) identified in a group-wise comparison of LGMT DICER1, SARC DICER1 and PIS DICER1 (Supplementary Table 5). f Visualization of functional enrichment (gene ontology) analysis of genes overlapping with DMRs identified in a group wise comparison between LGMT DICER1 and PIS DICER1 (related to Fig. S5h, i). BP biological process, MF molecular function, FDR false discovery rate. g Venn diagram showing the overlap of DMRs identified in group-wise comparisons of LGMT DICER1, SARC DICER1 and PIS DICER1. Venn-diagrams are plotted to scale.

