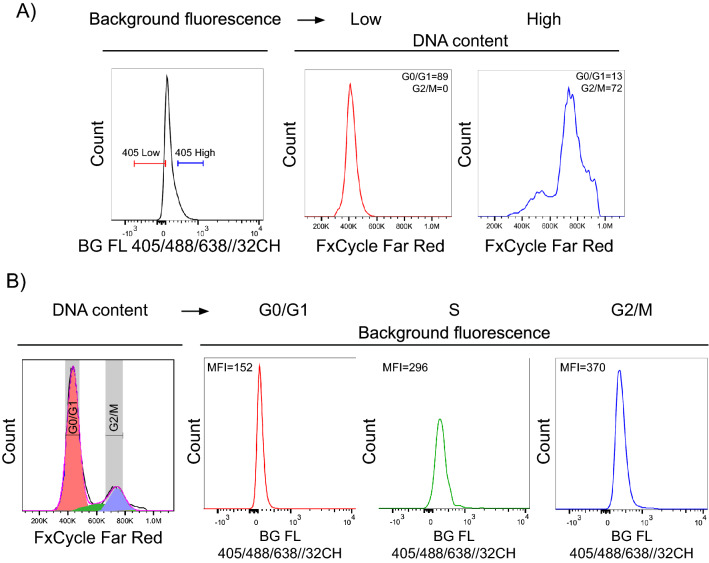
Figure 2.
Spectral flow cytometry confirms the association of background fluorescence and cell cycle state. HCT 116 cells were stained using LIVE/DEAD Fixable Dead Cell Stain Kit, fixed in 4% PFA and DNA was labelled using FxCycle Far Red Stain. The background fluorescence was measured in the range of 420–800 nm using 32 detectors with a spectral analyzer (SONY SP6800). (A) Representative image of background fluorescence and cell cycle profile of HCT 116 cells detected after simultaneous 405, 488, and 638 nm excitation. Dead cells were excluded and fractions of cells with low (bottom 10%) and high (top 10%) background fluorescence were gated for DNA content (cell cycle) analysis. The values of G0/G1 and G2/M phase represent the proportion of cells. (B) Examples of reversed gating strategy, when modelled cell phases (FlowJo) were gated and analyzed for background fluorescence. Median fluorescence intensity (MFI) was then calculated for each phase. Data are representative from two independent repetitions. For total DNA content distribution of the whole population, see Supplementary Fig. 8B.

