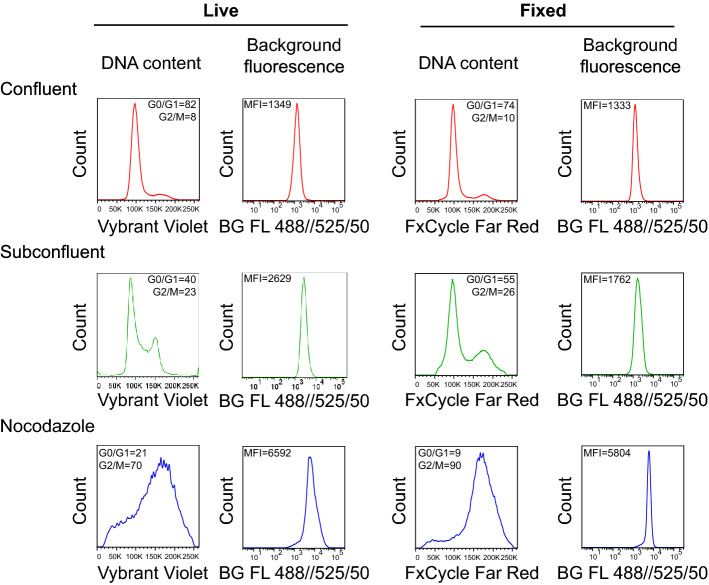
Figure 3.
Experimental modulation of cell cycle progression affects the background autofluorescence. HCT 116 cells were synchronized to G0/G1 phase by cultivation to the full confluency (red line plots) or arrested in the G2/M phase with nocodazole treatment (blue line plots). Control HCT 116 cells were cultivated in standard subconfluent conditions (green line plots; see Methods for details). Dead cells were excluded from analysis using LIVE/DEAD Fixable Dead Cell Stain Kit. The cell cycle was then analyzed in both native (Vybrant DyeCycle Violet) and fixed (FxCycle Far Red Stain) conditions. Together with background fluorescence. The numbers of G0/G1 and G2/M phases represent a percentage of cells. The values of G0/G1 and G2/M phase represent the proportion of cells. Data are representative from two independent repetitions. MFI median fluorescence intensity.

