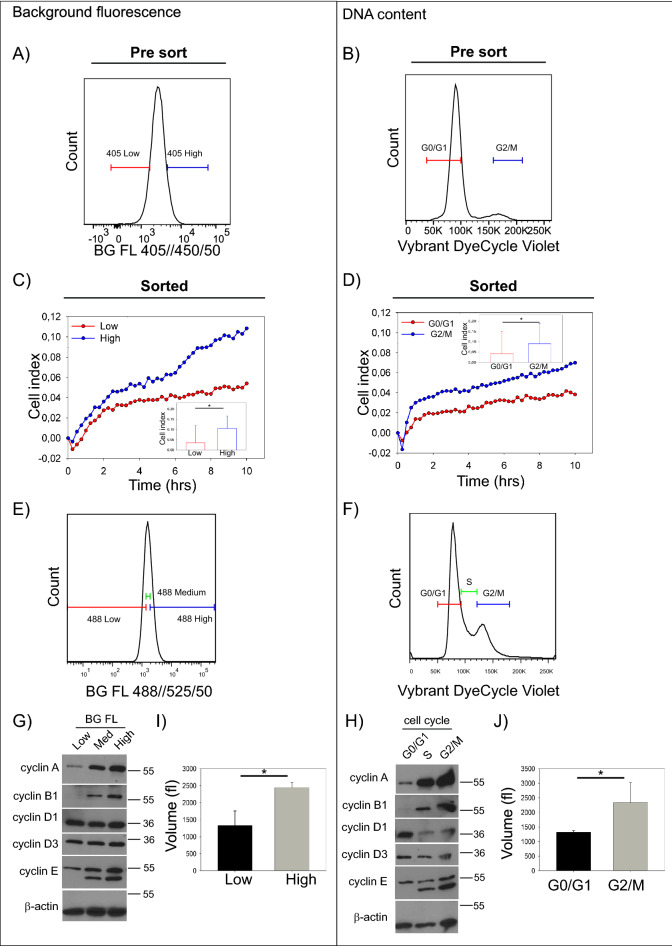
Figure 4.
Assessment of low and high background autofluorescence cell fractions in vitro. Representative figure showing fractions selected for direct functional comparison of live HCT 116 cells sorted based on 10% low and 10% high background fluorescence (A) or G0/G1 and G2/M cell cycle phases after staining with cell-penetrant, native DNA dye (Vybrant DyeCycle Violet), (B). Sorted cell fractions were subjected to real-time cell adhesion monitoring with signal being recorded every 15 min and cell index being a function of cell adhesion. The adhesion pattern of cells sorted based on the extent of their background fluorescence (C) resemble cells sorted based on their corresponding cell cycle phase (D). Data are pooled from three technical replicates per condition and three independent experiments are shown, for details see Methods (*~ P < 0.05 for cell index at 10 h), see Sup. Fig. 2 for post-sorting purity assessment. Similarly, distribution of selected cyclins is similar between cells sorted based on their background fluorescence (E,G) or cell cycle phase (F,H). Representative blots are from two independent replicates, uncropped membrane scans are provided in Sup. Fig. 7. Lastly, cell volume as determined with CASY TT follows the same pattern for cells sorted based on their background fluorescence (I) or cell cycle phase (J). Data pooled from three independent experiments and plotted as mean ± S.D. (*~ P < 0.05).

