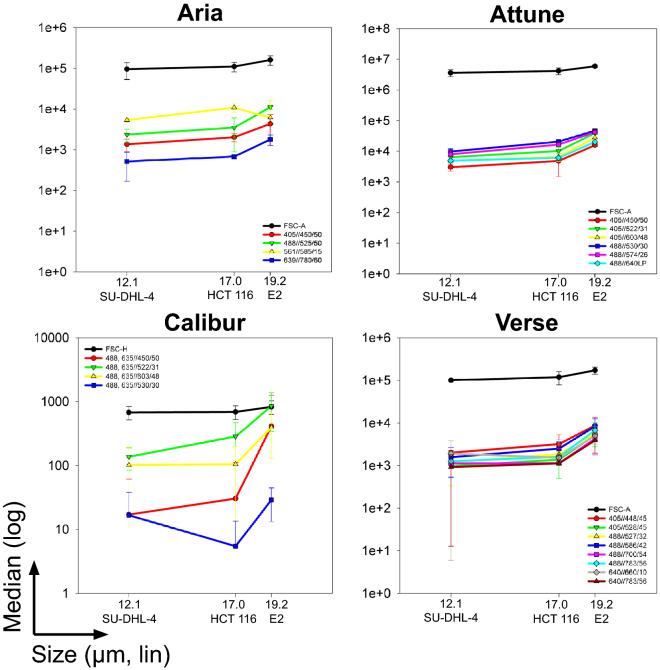
Figure 5.
Average cell size correlates with the background fluorescence intensity. The size of the three different cell lines SU-DHL-4 (average diameter 12 µm), HCT 116 (17 µm), and E2 (19 µm) was determined in suspension using the CASY TT cell counter. The unlabeled cells were then analyzed using four different flow cytometers and median background fluorescence for all available lasers (BD FACSAria II SORP) or detectors (TFS Attune, BD FACSCalibur, BD FACSVerse) was determined. Data are plotted as median ± S.D. from at least three biological replicates.

