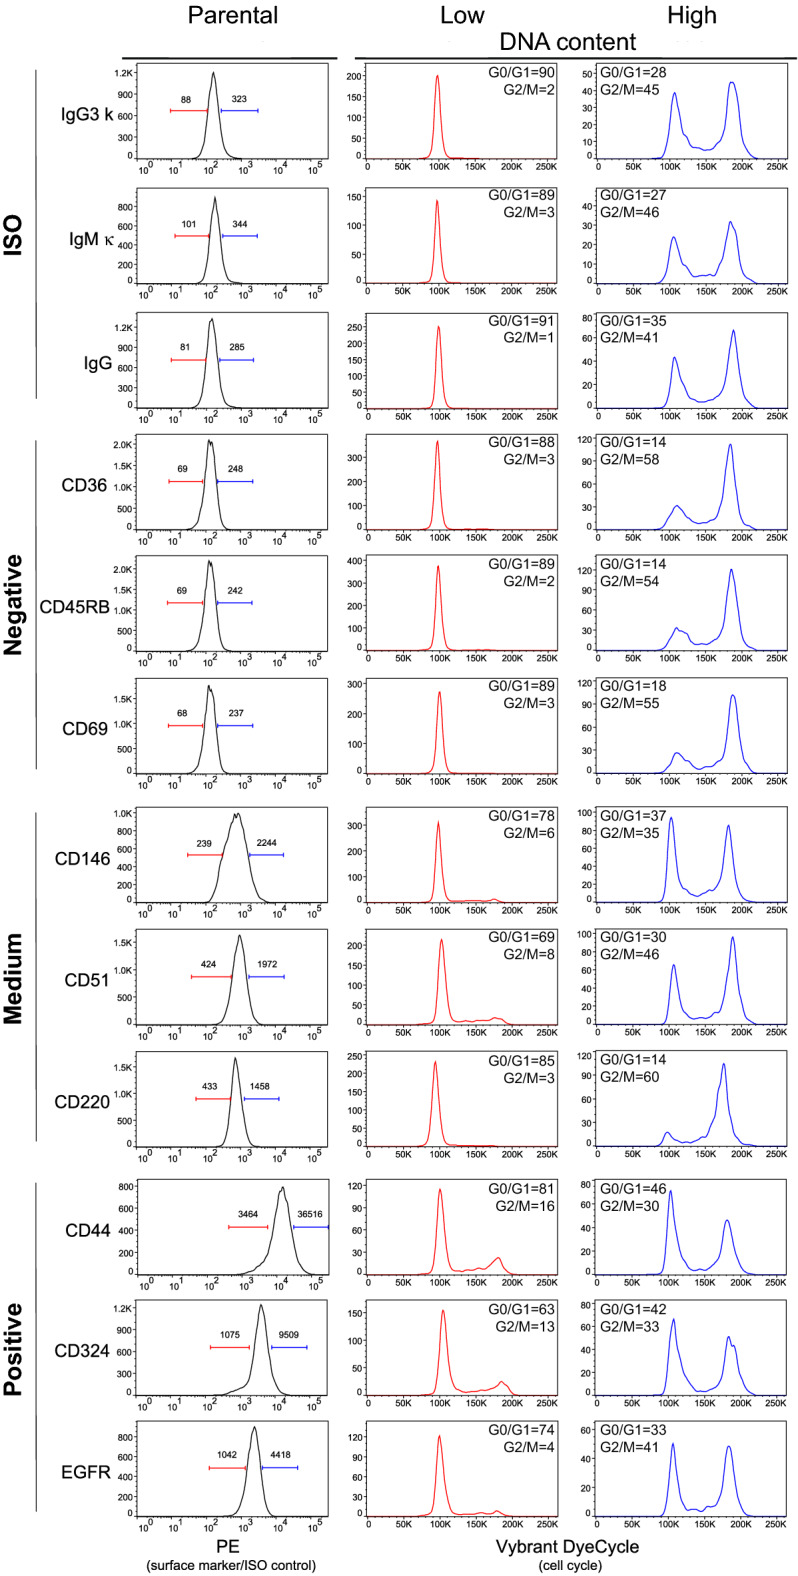
Figure 6.

High-throughput cell surface marker screen confirms general association between fluorescence distribution and cell cycle. Histograms in the first column represent characteristic examples of isotype (negative) controls, markers with undetectable expression (< 1% positivity), medium expression (~ 50% positivity) and markers with high, positive expression (> 99% positivity). The fractions of the cells with 10% low and 10% high specific fluorescence (PE channel) intensities were gated and analyzed for cell cycle distribution and are shown in the second and third column. The values of G0/G1 and G2/M phase represent cell proportions. Values above gating lines in the first histogram column of the histograms represent median fluorescence intensities of gated cell fraction. Screen was performed with LEGENDScreen human PE kit, for details see Methods. For total DNA content distribution of the whole population and gating strategy see Sup. Fig. 5.
