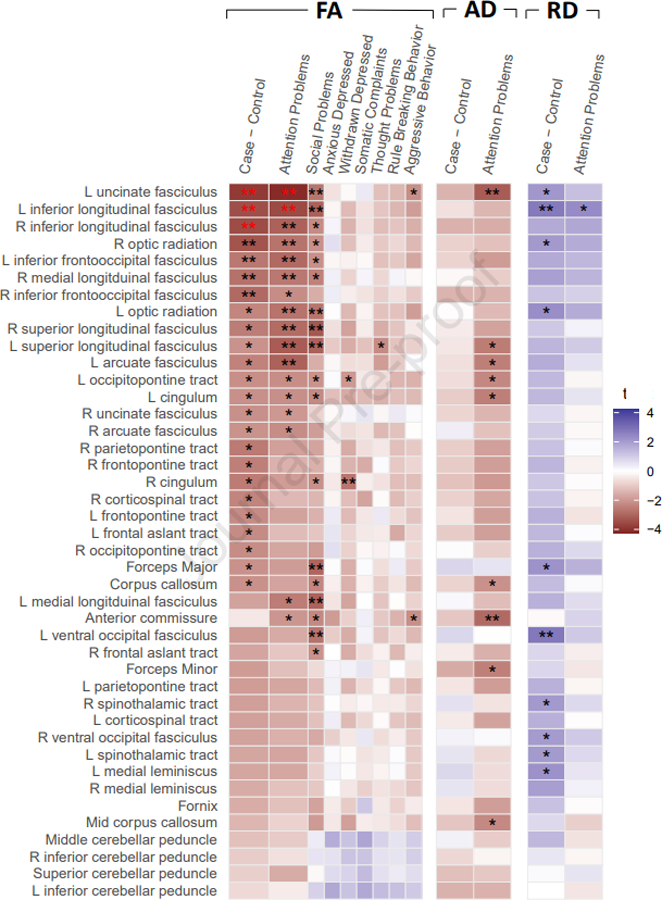
Figure 1.

Association between fractional anisotropy of white matter tracts and ADHD diagnosis, and scores on the empirical subscales from the Child Behavior Checklist. Colors indicate t-statistic, single black stars are nominally significant p < .05, double black stars at p < .01, and double red stars mark associations significant at FDR adjusted p < .05. Results for AD and RD metrics are exploratory only, and displayed for comparison to the main FA results.
