
Figure 1. Illustrative Examples of Classic and Drive-Dependent OSA.
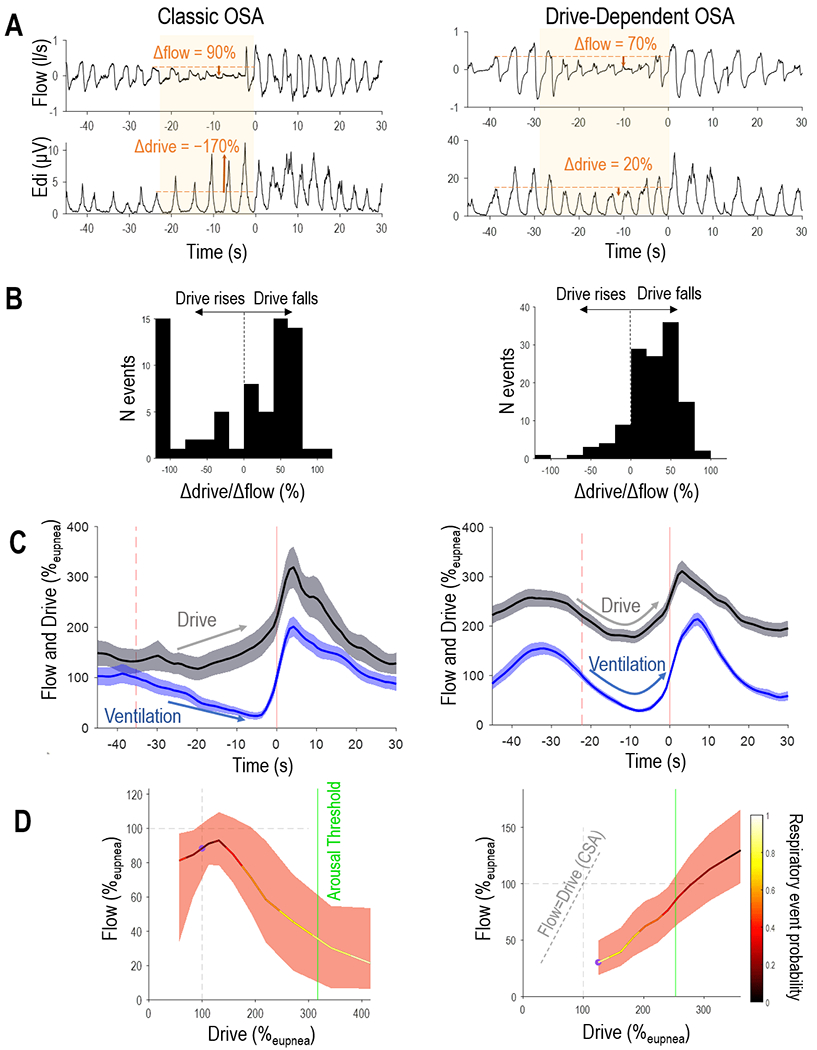
Compared to the patient exhibiting classic OSA (left), the individual with drive-dependent OSA (right) exhibits a characteristic fall in drive during individual events, seen in raw signals data (A) and histogram of drive changes (Δdrive/Δflow in B). Note that the drive-dependent patient shows a fall in drive that is in synchrony with the event-related loss of flow (ensemble average in C; shading describes 95%CI) and raises ventilation when ventilatory drive is spontaneously elevated during sleep (“endogram” plot of flow v. drive in D; black line show median flow for 10 drive deciles; shading describes IQR). In contrast, the example individual with classic OSA exhibits falling flow despite rising drive. Note also that the flow-drive profile in drive-dependent OSA is to the right of the line of unity (dashed line), indicating pharyngeal obstruction (in contrast with central sleep apnea [CSA] where flow=drive).