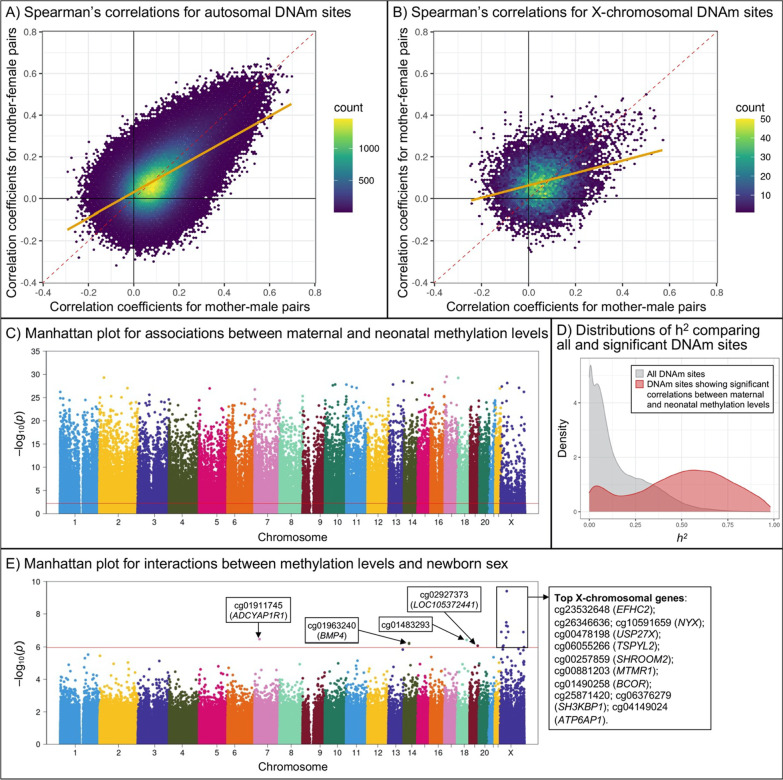
Fig. 2.
Sex differences in mother–newborn correlations in methylation levels at individual DNAm sites. We first illustrated Spearman correlations in mother–newborn correlations in methylation levels of individual DNAm sites on A) autosomes and B) the X chromosome, stratified by newborn sex. The orange regression lines represent the concordance of correlation coefficients for mother–male and mother–female pairs. Second, we used C) Manhattan plot to show the distribution of p values from likelihood ratio test that estimated the associations in methylation levels at individual DNAm sites between mothers and their newborns; the red horizontal line marks FDR = 0.05. We also used D) density plot to compare the heritability of DNAm sites showing significant mother–newborn associations to that of DNAm sites across the whole genome using data from a published study on DNAm quantitative trait loci [25], but only the heritability of autosomal DNAm sites was available. Finally, we used E) Manhattan plot to show the distribution of p values of the interaction term of newborn sex and maternal methylation levels (neonatal methylation levels as the outcome) for individual DNAm sites; the red horizontal line marks FDR = 0.05. Linear regression models were adjusted for maternal age at delivery, maternal race/ethnicity, maternal smoking, preterm birth, type of delivery, and 36 surrogate variables. DNAm, DNA methylation; h2, heritability

