
Figure 7.
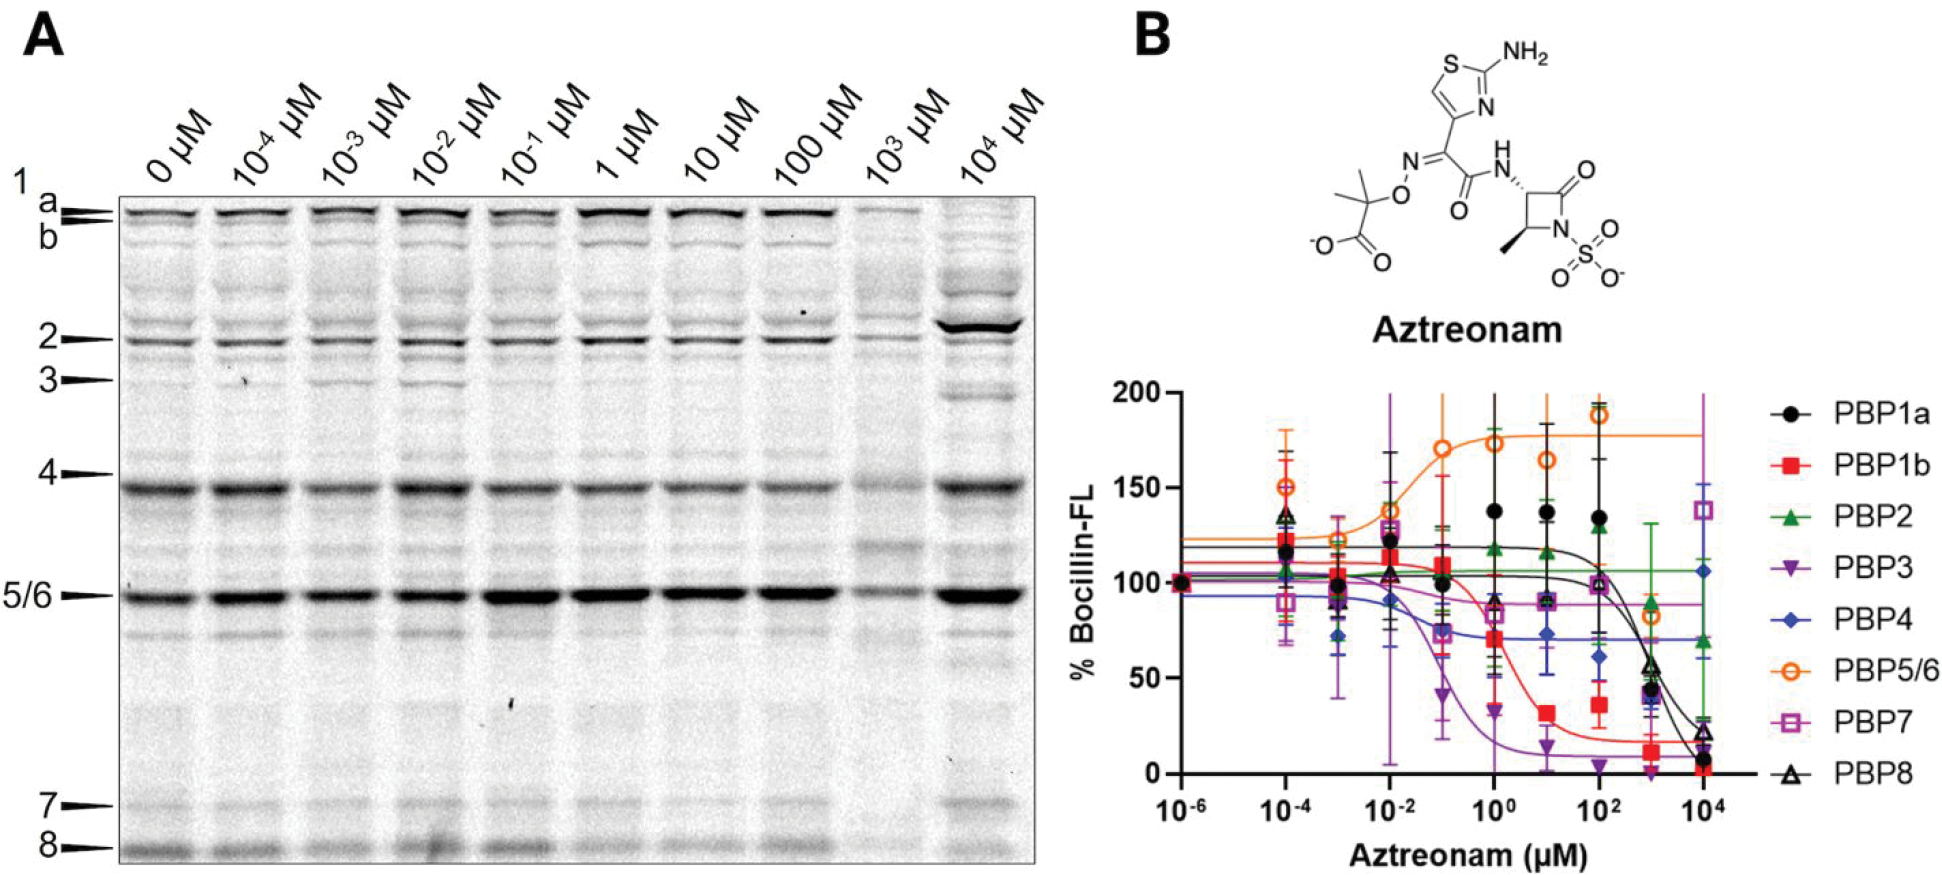
Aztreonam titration in E. coli MG1655. (A) Cells treated with increasing concentrations of aztreonam in Tris-EDTA, followed by labeling with Bocillin-FL. Selective inhibition of PBP3 was observed, along with increased Bocillin-FL labeling of PBP2, PBP4, PBP5/6, and PBP7 (10 mM). (B) Relative percent Bocillin-FL intensities plotted versus aztreonam concentration. Mean values from biological triplicates are plotted with error bars representing standard deviations.