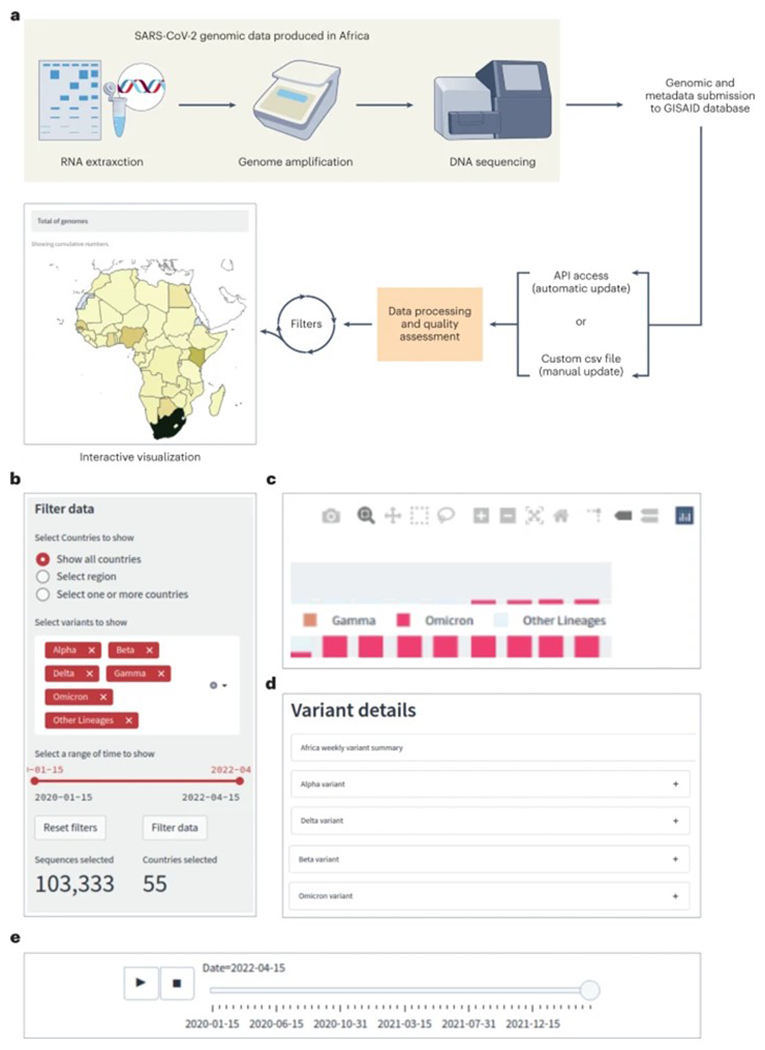
Figure 1. Incorporation of SARS-CoV-2 data into the SARS-CoV-2 Africa dashboard.

(A). The main features of the interface are: (B) General filters that allow users to select the data of interest, (C) Figure controls allow users to enable and disable legend elements, labels, select a part of the figure, zoom in, and out, and download the plot, (D) A tabulated description and mutation map is provided for variants that are of interest/importance at the time of access, and (E) Timeline player that displays the mapped progression of the pandemic over time, based on the filter selection.
