
Figure 4.
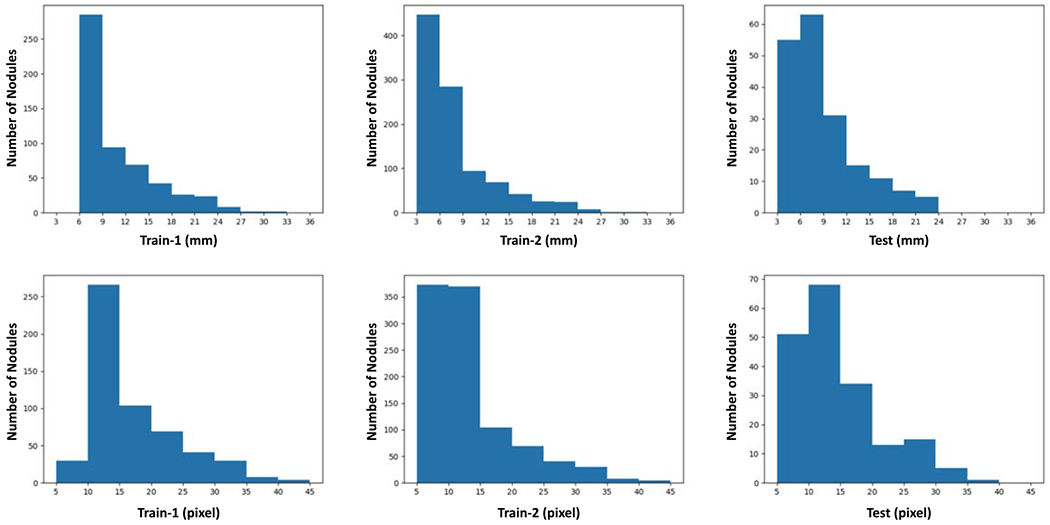
Long nodule distributions on different datasets. ‘Train-1’ and ‘Train-2’ show the nodule size distribution for the training datasets in the fist and second settings respectively, and ‘Test’ denotes the distributions on the test dataset in the fist and second settings. ‘mm’ and ‘pix’ represent the physical size and the number of pixels of nodule diameter respectively.