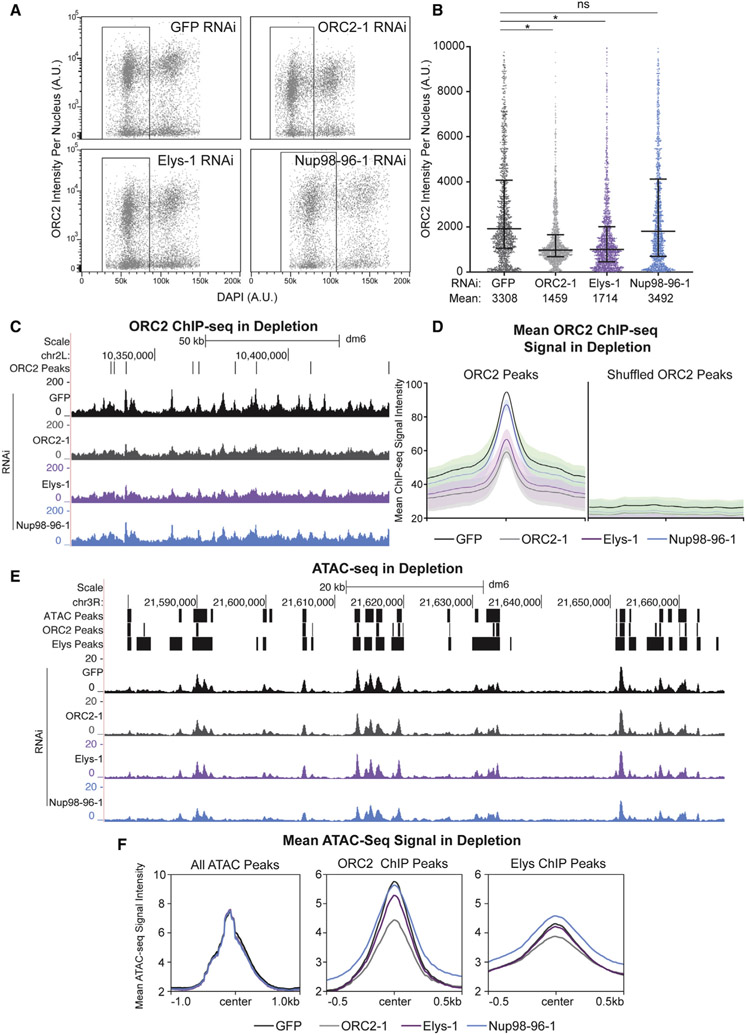
Figure 3. ORC’s chromatin association depends on Elys.
(A) Horseshoe plot of nuclei with DNA content (DAPI) plotted against ORC2 intensity for each depletion from one replicate. Black box indicates G1 population of nuclei used for the quantification in (B). A.U., arbitrary units.
(B) Quantification of ORC2 intensity in 1,500 randomly selected G1 nuclei from three biological replicates. Asterisk indicates p < 0.0001 relative to the negative control. NS, no significance.
(C) Representative UCSC genome browser view of ORC2 ChIP-seq profiles for each depletion. ORC2 binding sites (ORC2 peaks, defined by Eaton et al., 2011) are indicated by black bars.
(D) Quantification of mean ORC2 ChIP-seq signal within defined ORC2 peaks or shuffled ORC2 peaks, centered on ORC2 peaks or shuffled ORC2 peaks, respectively, for two biological replicates.
(E) Representative UCSC genome browser view of ATAC-seq for each depletion for one biological replicate. ATAC-seq peaks, ORC2 ChIP-seq peaks, and Elys ChIP-seq peaks are indicated by black bars.
(F) Quantification of mean ATAC-seq signal for either all ATAC-seq peaks (n = 12,771), ORC2 ChIP-seq peaks (n = 4,280), or Elys ChIP-seq peaks (n = 12,048) centered on their respective peaks. Note that the scales are different for all ATAC-seq peak plots.

