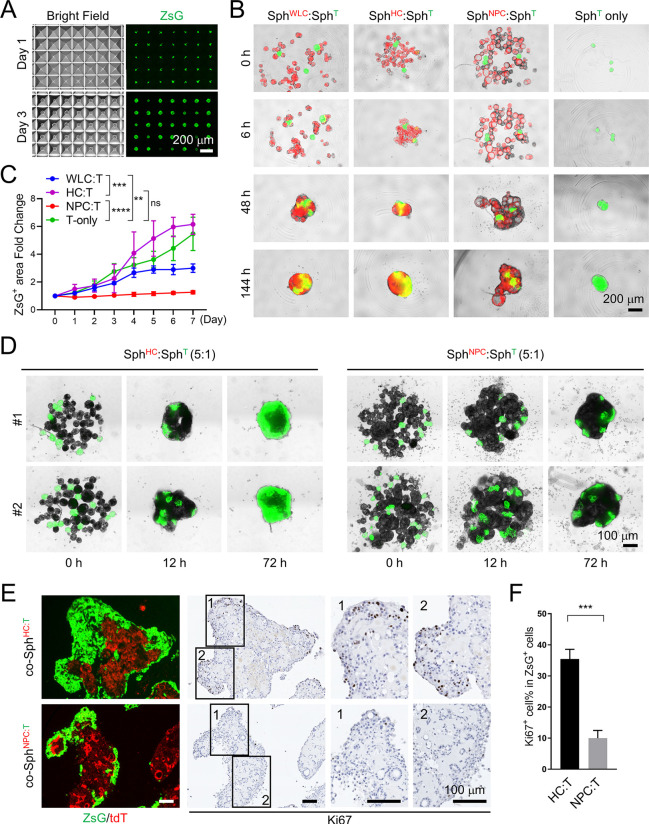
Fig. 3.
NPC spheroids, not HC spheroids, suppress the growth of Prom1CreERT2; Ptenflx/flx; Tp53flx/flx; Rosa-ZsGreen (PPTR) liver tumor cells in spheroid suspension co-cultures. (A) Day 1 and Day 3 brightfield and ZsGreen (ZsG) fluorescence images of PPTR liver tumor spheroids in AW400 plates. Scale bar: 200 µm. (B) Merged ZsG/tdT images of the indicated spheroid co-cultures at the indicated times. Normal spheroids and tumor spheroids were mixed in a 15:1 ratio. Scale bar: 200 µm. (C) Fold change of the ZsG+ tumor area in the co-culture conditions from Day 0 to Day 7. Two-way ANOVA; **P<0.01, ***P<0.001, ****P<0.0001; ns, not significant. (D) ZsG images of SphHC:SphT and SphNPC:SphT co-cultures at the indicated times. Normal spheroids and tumor spheroids were mixed in a 5:1 ratio. Scale bar: 100 µm. (E) Merged ZsG/tdT images and Ki67 IHC of SphHC:SphT co-spheroids (co-SphHC:T) and SphNPC:SphT co-spheroids (co-SphNPC:T) collected after 7 days in co-culture. Scale bars: 100 µm. (F) Quantification of the Ki67+ cell content among the ZsG+ tumor cells in the co-SphHC:T and co-SphNPC:T. Images are representative of three independent batches of spheroid co-culture. Unpaired two-tailed Student’s t-test; ***P<0.001.

