Fig. 4.
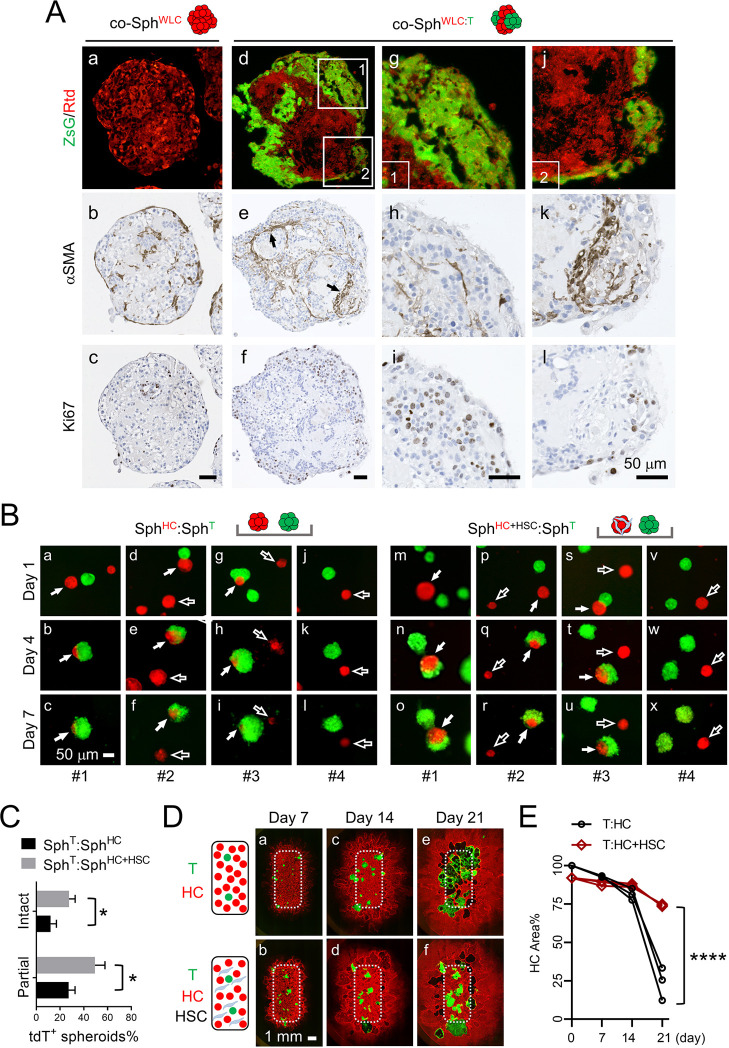
Activation and a hepatoprotective role of hepatic stellate cells (HSCs) in tumor–liver interaction. (A) ZsG/tdT images and IHC of αSMA and Ki67 in co-SphWLC and co-SphWLC:T sections. (g-i) Enlarged images of the boxed Area 1 in d; (j-l) enlarged images of the boxed Area 2 in d. Scale bars: 50 µm. (B) ZsG/tdT images of the indicated two spheroid co-cultures on Day 1, 4 and 7. Four examples are shown in each condition. Images in the same column are taken from the same areas of the co-cultures. Filled arrows indicate tdT+ SphHC and SphHC+HSC in direct contact with ZsG+ SphT; open arrows indicate tdT+ SphHC and SphHC+HSC that are not in contact with ZsG+ SphT. Scale bar: 50 µm. (C) Quantification of the percentage of partially ‘eaten’ and intact tdT+ spheroids on Day 7 compared to Day 1 in each co-culture condition. Counting was performed from three independent batches. Unpaired two-tailed Student’s t-test; *P<0.05. (D) Schematic representation and ZsG/tdT images of T:HC and T:HC+HSC 2D co-cultures on Day 7, 14 and 21. Dotted line boxes indicate the original seeding area within the chamber insert. Scale bar: 1 mm. (E) Percentage of the area occupied by tdT+ HCs within the boxed area in D on Day 7, 14 and 21 in comparison to Day 1. Images are representative of three independent batches of spheroid and 2D co-culture. Two-way ANOVA; ****P<0.0001.

