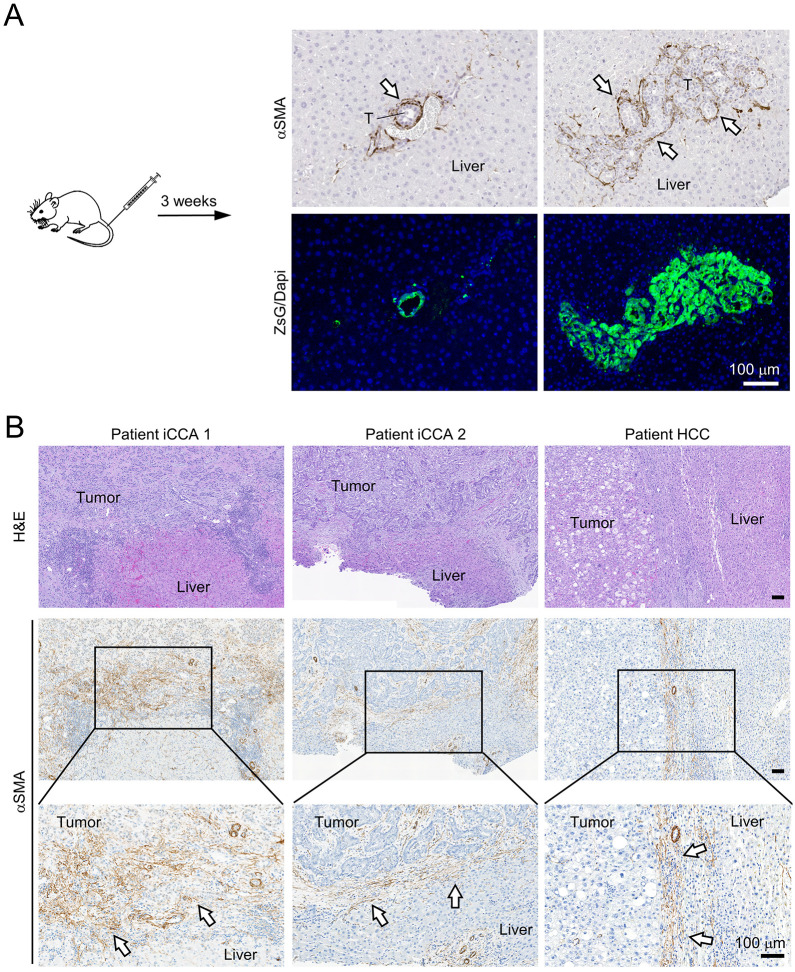
Fig. 5.
Peritumoral HSC activation in early-stage mouse and patient liver tumors. (A) Images of αSMA IHC and matching ZsG/DAPI fluorescence of 3-week PPTR liver tumors generated via tail vein injection. Arrows indicate αSMA+ cells at the tumor border. T, tumor. Scale bar: 100 µm. Images are representative of tumors from five mice. (B) H&E staining and αSMA IHC of two intrahepatic cholangiocarcinoma (iCCA) and one hepatocellular carcinoma (HCC) early-stage tumors from patients. Arrows indicate αSMA+ cells at the tumor border. Scale bars: 100 µm.

