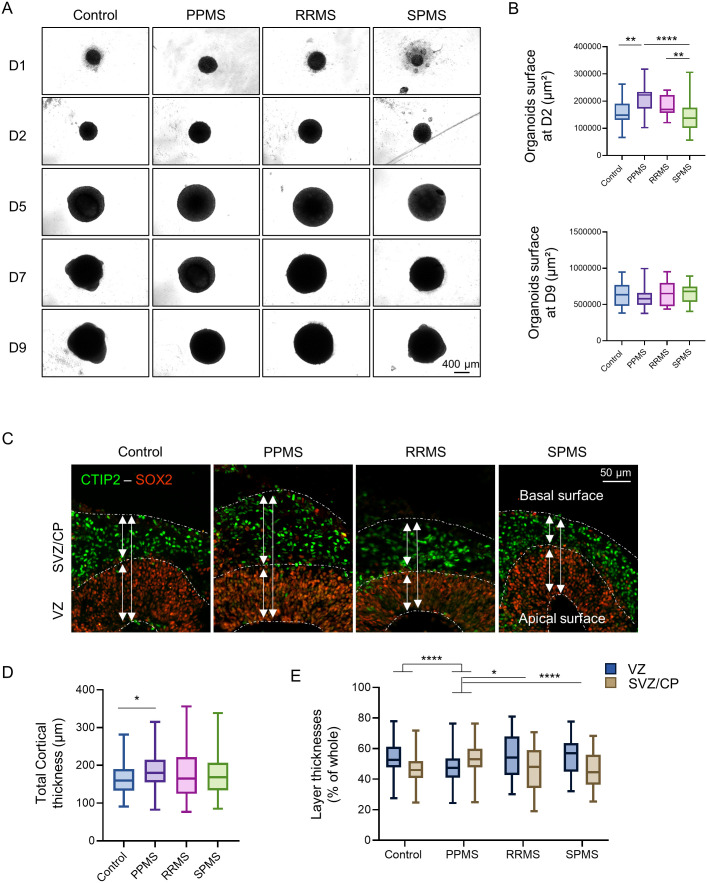
Fig. 1.
MS organoids display altered growth rate in culture. (A) Brightfield pictures of c-organoids derived from control and MS patients in culture from day 1 to day 9. (B) Measurements of c-organoids surface in µm² at D2 (top graph) and at D9 (bottom graph). Analysis showed significant larger PPMS organoids compared to control at D2 only. Kruskal–Wallis test (H value=31.30, P<0.0001) followed by a Dunn's post hoc test. No significant difference was detected at D9. Kruskal–Wallis test (H value=2.88, P=0.4098). (C) Immunofluorescence of c-organoids at D42 for the stem cell marker SOX2 and neuronal marker CTIP2. The staining shows a neat separation between the VZ and the SVZ/CP in the c-organoids cortical structure. (D) Measurement of the c-organoids cortical structure thickness for control and MS subtypes at D42. Quantification revealed a significantly thicker cortical structure in PPMS compared to control. Kruskal–Wallis test (H value=8.323, P=0.0398) followed by a Dunn's post hoc test. (E) Measurement of the thickness of the two main layers of the cortical structure, the VZ and the SVZ/CP at D42. Quantification showed that PPMS organoids possessed a significantly larger SVZ/CP and a thinner VZ compared to other conditions. Two-way ANOVA [F (3, 532)=20.13, P <0.0001] followed by Tukey's post hoc test. n=3 organoids per cell line from three to four independent experiments each. One to two cortical structures were analyzed per organoid. *P<0.05, **P<0.01, ***P<0.001, ****P<0.0001.

