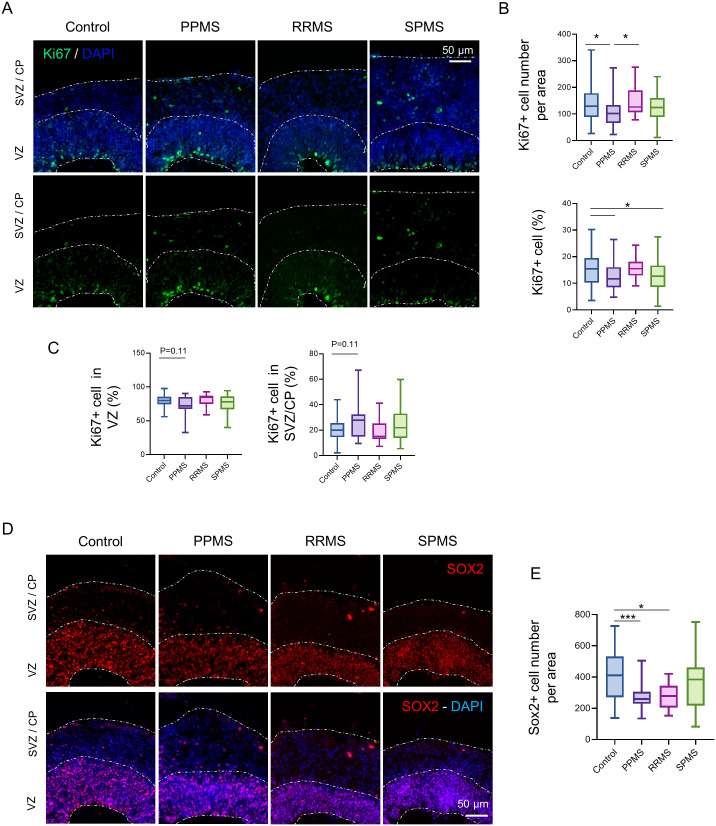
Fig. 2.
Impairment of stem cell population in MS organoids. (A) Representative images of an immunofluorescence against the proliferation marker Ki67 in c-organoids at D42. (B) Quantifications of Ki67+ cells number and percentage of Ki67+ cells in the organoids cortical structure at D42. Quantifications revealed a decrease of Ki67+ number (Kruskal–Wallis test, H value=11.77, P=0.0082, followed by a Dunn's post hoc test) as well as percentage in PPMS compared to control (one-way ANOVA, F (3, 217)=4.274, P=0.0059, followed by Tukey's multiple comparisons test). (C) A quantification of the percentage of Ki67+ cells in the VZ (radial glia) and the SVZ/CP (intermediate progenitor cells and neuroblast) was performed. A slight decrease was detected in the VZ while an increase was observed in the SVZ/CP (Kruskal–Wallis test, H value=8.38, P=0.0387 followed by a Dunn's post hoc test). (D) Representative images of an immunofluorescence against the NPC marker SOX2 in c-organoids at D42. (E) Quantification of SOX2+ cells in c-organoids cortical layers showed a significant lower SOX2+ cell number in PPMS and RRMS compared to control organoids (one-way ANOVA, F (3, 138)=6.191, P=0.0006, followed by Tukey's post hoc test). To ensure quantification consistency, analyzed cortical area were cropped from the original picture to a 250 µm wide×300 µm image, spanning all cortical layers (VZ, SVZ, and CP). n=3 organoids per cell line from three to four independent experiments each. One to two cortical structures were analyzed per organoid. *P<0.05, **P<0.01, ***P<0.001, ****P<0.0001.

