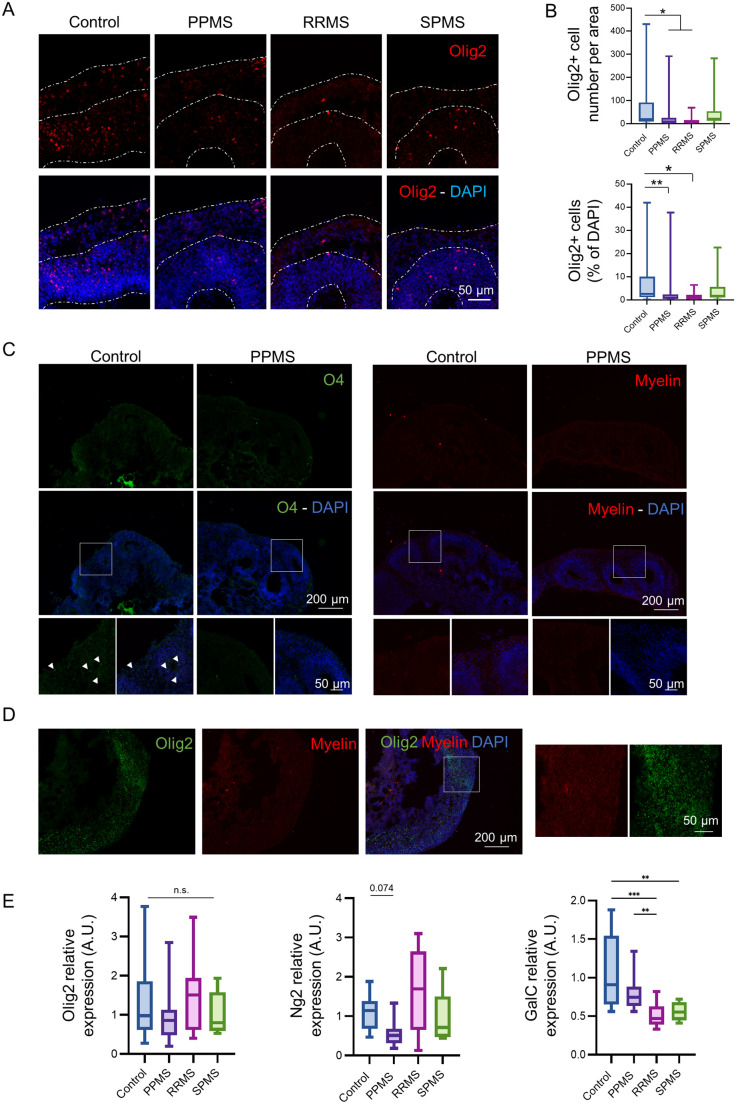
Fig. 4.
MS organoids display an increased number of mature neurons and a reduced oligodendrocyte population. (A) Immunofluorescence pictures of oligodendrocyte precursors (Olig2) in c-organoids at D42. Olig2+ cells were mostly localized in the VZ. (B) Quantification of Olig2+ cell number per area and of the percentage of Olig2+ cells per area. Quantification revealed a significant lower number of Olig2+ cells in PPMS and RRMS organoids compared to control (Kruskal–Wallis test, H value=14.07, P<0.0028, followed by a Dunn's post hoc test), as well as a lower percentage of Olig2+ cells in PPMS and RRMS compared to control (Kruskal–Wallis test, H value=14.77, P<0.0020, followed by a Dunn's post hoc test). (C) Representative pictures of an immunofluorescence for mature oligodendrocyte marker O4 (left) and a staining for myelin (Fluoromyelin, right) in c-organoids at d42. White squares represent a zone selected for higher magnification picture (below). White arrowheads show O4+ cells. (D) Immunostaining for Olig2 and myelin in c-organoids. An area with a high density of Olig2+ cells was selected to observed myelin staining. White squares represent a zone selected for higher magnification picture (right panel). (E) Relative mRNA levels of human Olig2, Ng2 and GalC assessed by quantitative PCR on cerebral organoids at d42. No significant difference was found for Olig2 (Kruskal–Wallis test, H value=3.8, P=0.2825), while a slight difference was observed for Ng2 (Kruskal–Wallis test, H value=10.82, P=0.012 followed by a Dunn's post hoc test). A significant lower expression of GalC was detected in MS organoids compared to control (Kruskal–Wallis test, H value=22.30, P<<0.0001, followed by a Dunn's post hoc test). Quantitative PCR results were performed on six organoids per condition, from three independent experiments. To ensure quantification consistency, analyzed cortical area were cropped from the original picture to a 250 µm wide×300 µm image, spanning all cortical layers (VZ, SVZ, and CP). n=3 organoids per cell line from three to four independent experiments each. One to two cortical structure were analyzed per organoid. *P<0.05, **P<0.01, ***P<0.001, ****P<0.0001.

