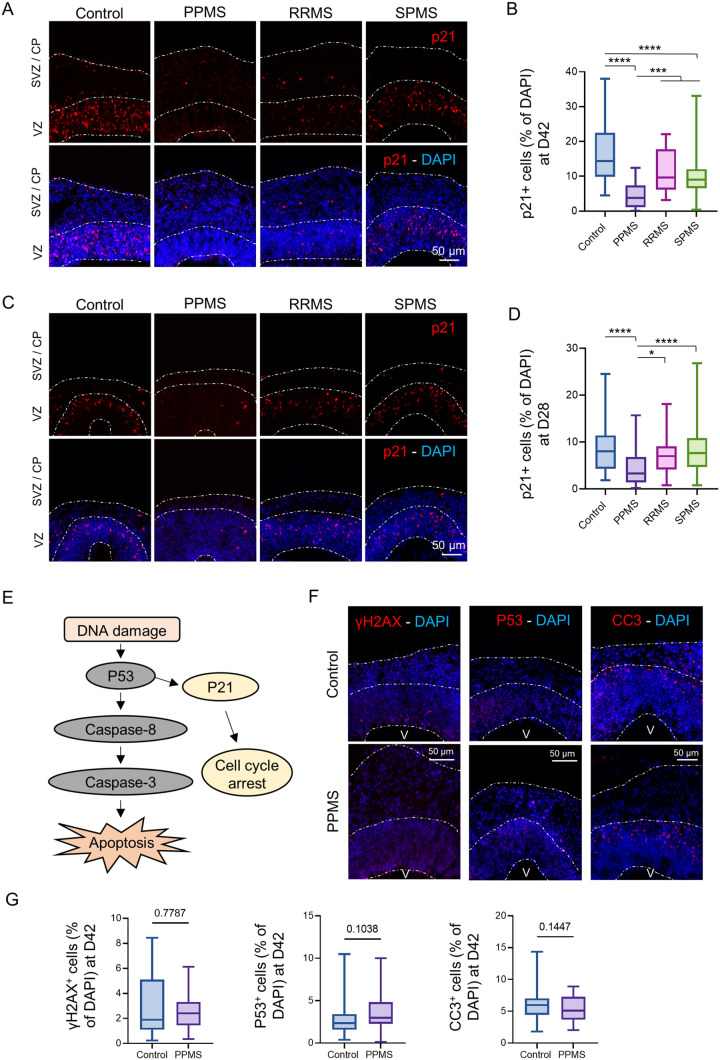
Fig. 5.
p21 expression is drastically reduced in PPMS organoids. (A) Representative images of an immunofluorescence against the cyclin-dependent kinase inhibitor marker p21 in c-organoids at D42. p21+ cells were mostly expressed in the VZ and the SVZ. (B) p21+ cells percentage was counted in the c-organoids cortical structure. A strong and significant decrease of p21 expression was detected in PPMS compared to control, RRMS and SPMS (Kruskal–Wallis test, H value=95.64, P<0.0001, followed by a Dunn's post hoc test). (C) Representative images of an immunofluorescence against p21 in c-organoids at D28. p21+ cells were mostly expressed in the VZ. (D) Quantification of p21+ cells in c-organoid cortical structures. A significant decrease of p21 percentage was detected in PPMS compared to control, RRMS and PPMS. (Kruskal–Wallis test, H value=53.02, P<0.0001, followed by a Dunn's post hoc test). (E) Schematic description of the DNA damage pathway, induced by DNA damage and leading to apoptosis. (F) Immunofluorescence for DNA damage marker γH2AX, transcription factor p53 and apoptosis marker cleaved caspase 3 (CC3) in PPMS and healthy control organoids at D42 in cropped images of 250 µm wide×300 µm, spanning all cortical layers (VZ, SVZ and CP). No noticeable difference was observed in the different marker between control and MS cortical structure. V: ventricle. (G) Quantification of the percentage of γH2AX+ cells (two-tailed Mann–Whitney test, P=0.7787) p53+ cells (two-tailed Mann–Whitney test, P=0.1038) and CC3+ cells (two-tailed unpaired t-test, P=0.1447) in control and PPMS c-organoids at d42. To ensure quantification consistency, analyzed cortical area were cropped from the original picture to a 250 µm wide×300 µm image, spanning all cortical layers (VZ, SVZ, and CP). n=3 organoids per cell line from three to four independent experiments each. One to two cortical structure were analyzed per organoid.

