Fig. 6.
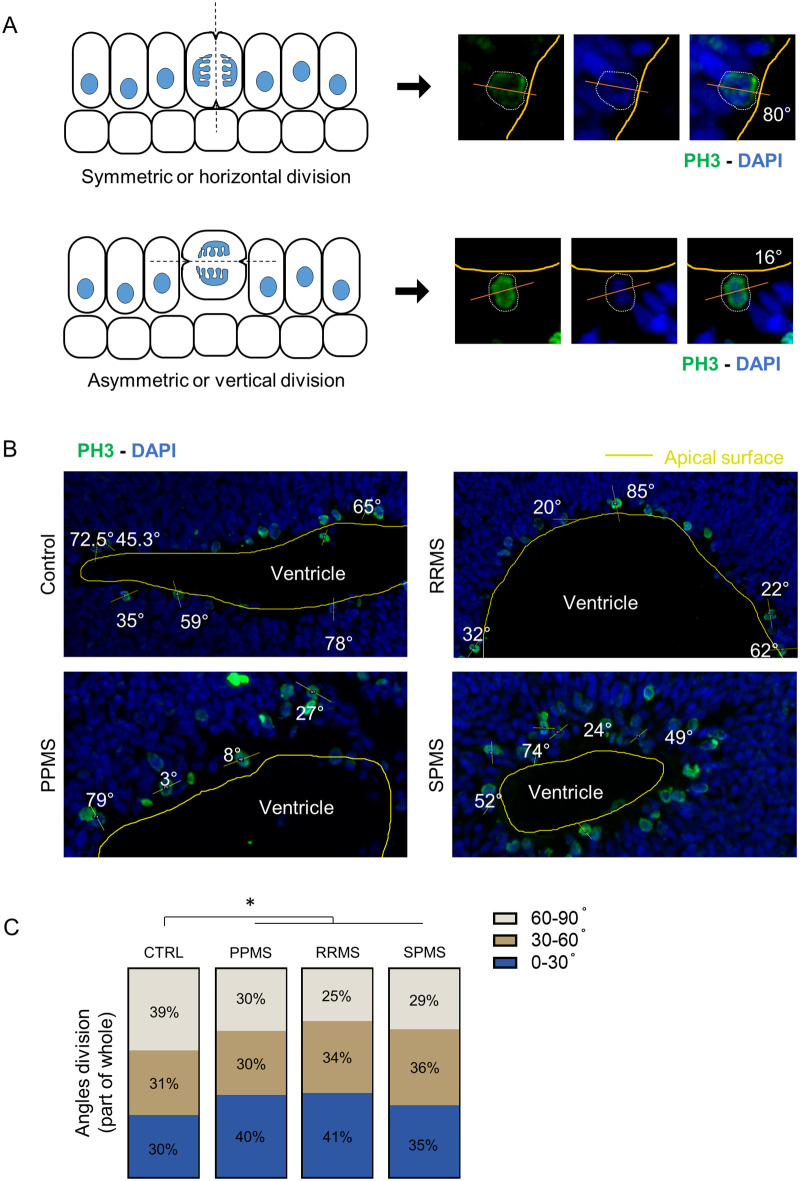
Radial glia division mode shift to asymmetric in PPMS. (A) Schematic representation of symmetric (horizontal) and asymmetric (vertical) division modes (left). Illustrative pictures of mitotic cells, identified by PH3 immunofluorescence, and their division angle measurements. Yellow line represents the apical surface of the ventricle, white dotted line represents the cell edge, the orange line represents the cell division axis. (B) Representative pictures of PH3 immunofluorescence in c-organoids at D42 in the different conditions. Measurement of division angle of mitotic cell was measured against the apical surface of the ventricle. Yellow lines represent the ventricle apical surface, orange lines represent the mitotic cell division axis. Angle are shown in degree. (C) Representation of the different angle division modes in part of whole measured in c-organoids at D42. 0–30° division mode represents a symmetric division (stemness) while 30–60° and 60–90° represent asymmetric division (neurogenic). A significant increase of asymmetric division was detected in all MS conditions compared to control. Chi-Square test; approximately 20 cells were counted per batch, four different batches containing three to four organoids were analyzed. *P<0.05, **P<0.01, ***P<0.001, ****P<0.0001.

