
FIGURE 3.
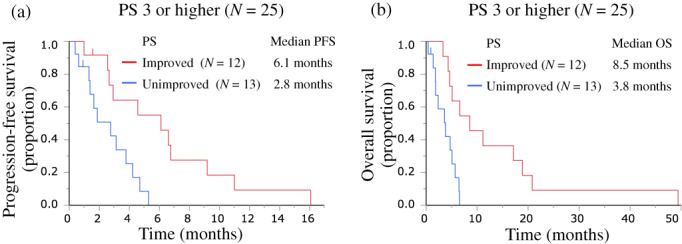
Curve showing PFS (a) and OS (b) according to post‐treatment PS after carboplatin plus etoposide therapy among the pretreatment PS ≥3 group (N = 25). OS, overall survival; PFS, progression‐free survival; PS, performance status
Official websites use .gov
A
.gov website belongs to an official
government organization in the United States.
Secure .gov websites use HTTPS
A lock (
) or https:// means you've safely
connected to the .gov website. Share sensitive
information only on official, secure websites.
Curve showing PFS (a) and OS (b) according to post‐treatment PS after carboplatin plus etoposide therapy among the pretreatment PS ≥3 group (N = 25). OS, overall survival; PFS, progression‐free survival; PS, performance status