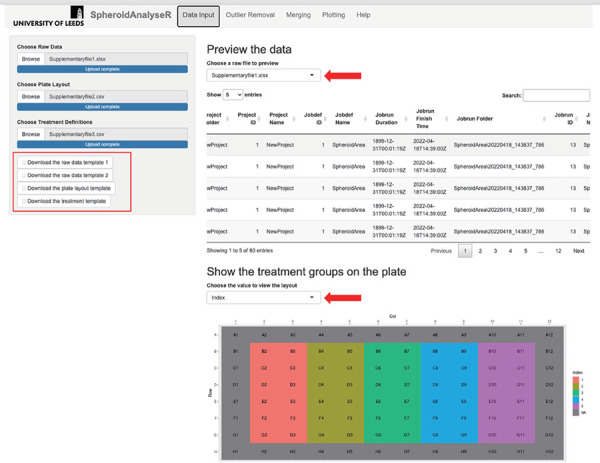
Figure 1.

The Data Input tab once raw data has been uploaded. Template files are available to download (see red rectangle). A raw file (File S1), plate layout (File S2) and treatment file (File S3) have been uploaded. A preview of the raw data is shown in the main panel, and a map of the plate colored by treatment index is displayed underneath. Red arrows show the dropdown menus to select a different file to view, and to choose a value to view the layout for.
