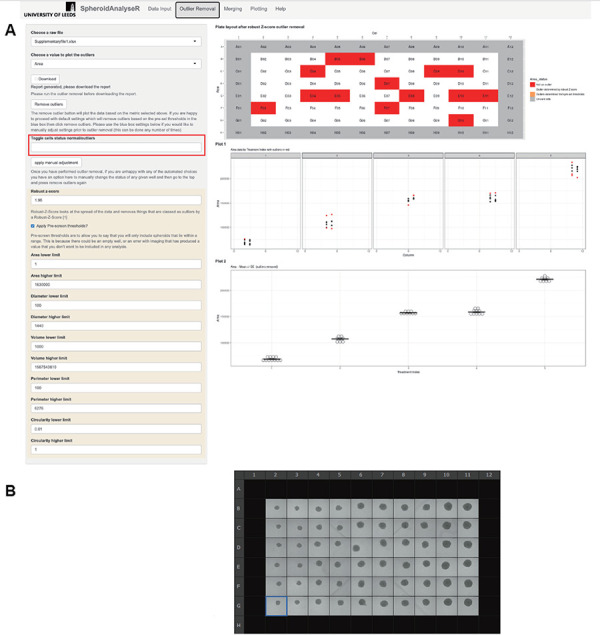
Figure 2.

The Outlier Removal. A. Inside the beige box are the adjustable outlier settings of Pre-screen-thresholds and Robust-Z-Score. After pressing the “Remove outliers” button, the outliers have been identified on the plate layout seen at the top of the panel. Orange shows outliers removed via pre-screen thresholds and red shows outliers removed after Robust-Z-Score. The results of either of these can be modified using the “Toggle cell status, normal/outlier” drop down menu. The user should select the wells to adjust and press “Apply manual adjustment”. The data can be downloaded as an excel spreadsheet via the Download button. B. The image of the plate of spheroids analyzed.
