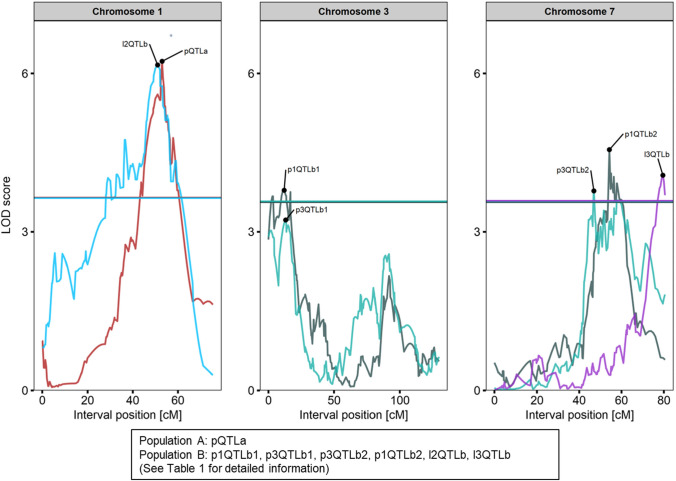
Fig. 4.
Logarithm of the odds (LOD) profiles of the identified QTL on chromosomes C01, C03, and C07 in the two F2 mapping populations. QTLs were labeled by trait (p = petiole, l = leaf) with numbers representing the replication and by mapping population (a = Population A, b = Population B) followed by a second number to distinguish multiple QTLs from one assay. LOD profiles from different assays are highlighted in different colors. Vertical lines indicate significance thresholds. Detailed information about each QTL are given in Table 1

