
Fig. 5.
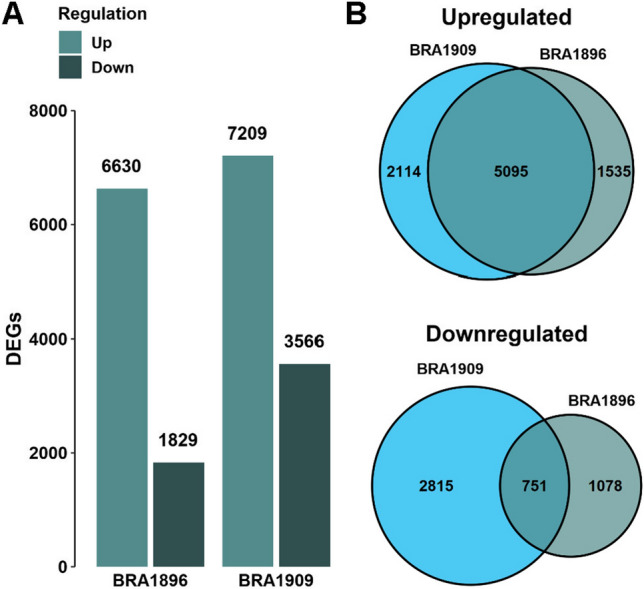
Differentially expressed gene (DEG) analysis between Sclerotinia- and mock-inoculated petioles of B. villosa (BRA1896) and B. oleracea (BRA1909). A Total amount of up- and downregulated DEGs in B. villosa and B. oleracea. B Comparison of up- and downregulated DEGs between the wild Brassica species. Genes were considered as differentially expressed in comparison to the mock-inoculated control based on an adjusted P value ≤ 0.05