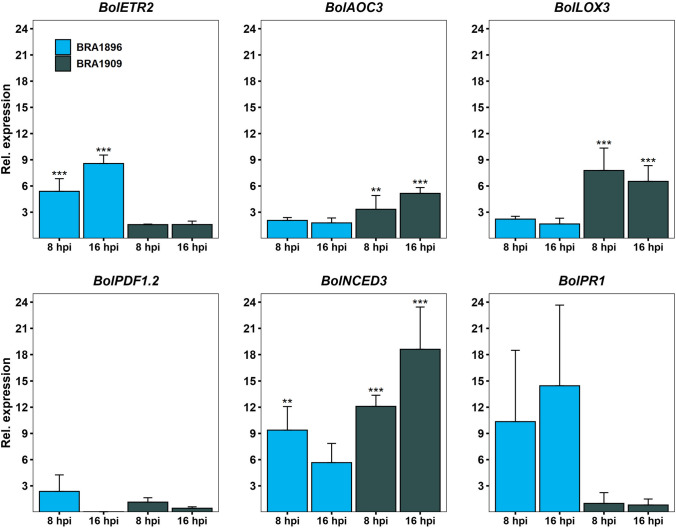
Fig. 6.
Marker gene expression analysis by reverse-transcribed quantitative PCR (RT-qPCR) in petioles of B. villosa (BRA1896, blue) and B. oleracea (BRA1909, gray) at 8 hpi to 16 hpi. Asterisks indicate a significant induction compared to the control group calculated by a linear model using generalized least squares and multiple contrast tests. **P adj. < 0.01, ***P adj. < 0.001. Error bars represent standard deviation of at least two biological replications. Primer used for RT-qPCR are listed in Supplementary Table S1 (colour figure online)

