
Figure 2.
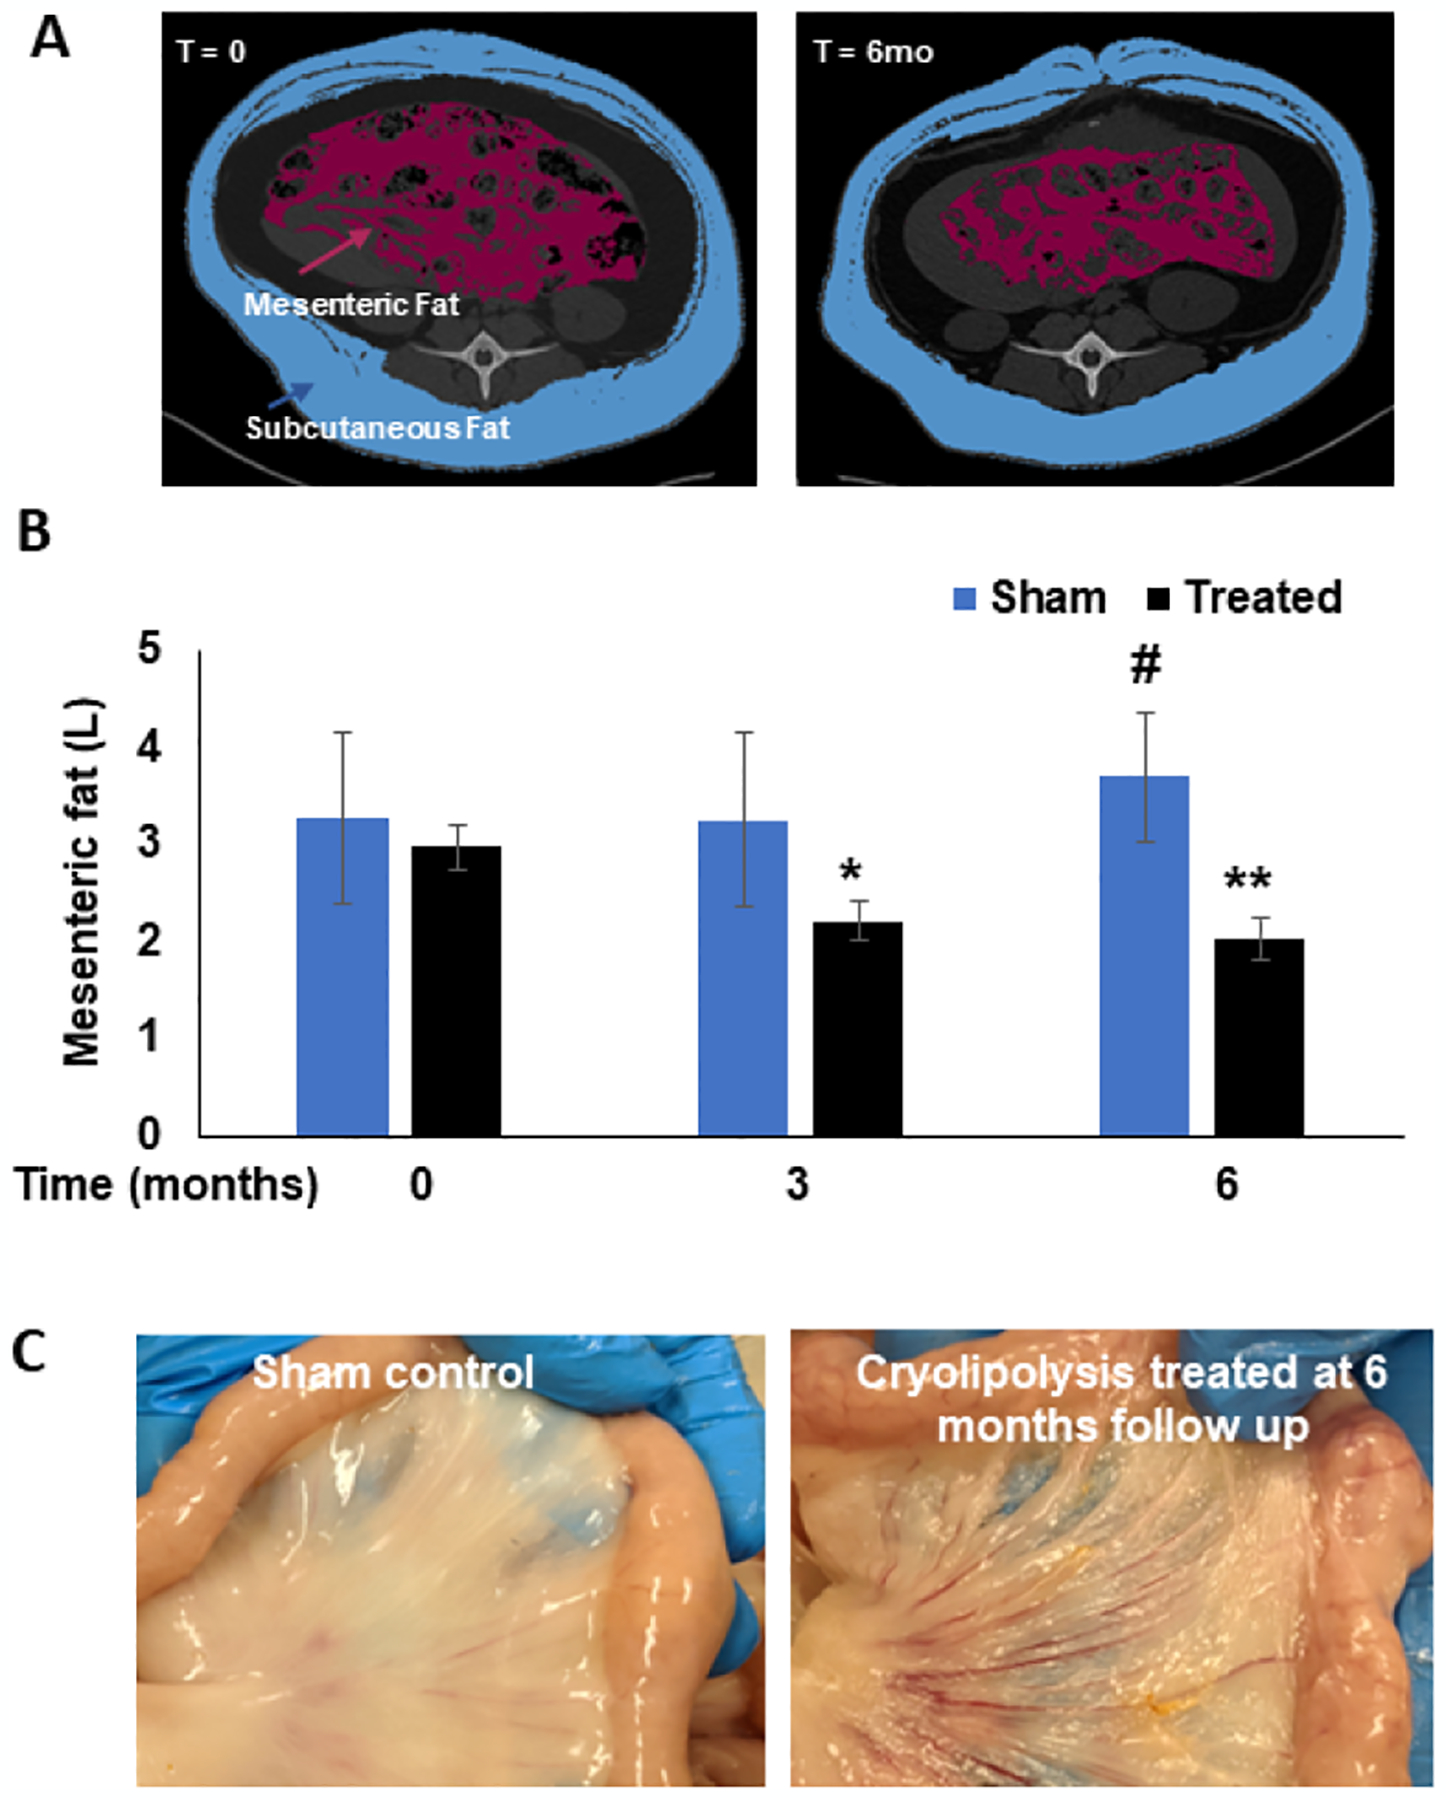
A. Representative CT images showing segmentation of the mesenteric fat (red) in a cryolipolysis treated pig before treatment (left) and the same pig at 6 months follow up (right). B. Volume of mesenteric fat in Sham (blue bars) and cryolipolysis-treated pigs (black bars) before treatment and at 3 and 6 months follow up. Data are presented as mean ± SEM. *P=0.009 treated at t=0 vs. t=3mo; **P=0.003 treated at t=0 vs. t=6mo. #P=0.01 sham vs. treated at t=6mo. C. Mesenteric fat of sham (left) and cryolipolysis-treated (right) at 6 months follow up, showing marked reduction in the thickness while no apparent damage to the microcirculation or the intestine.