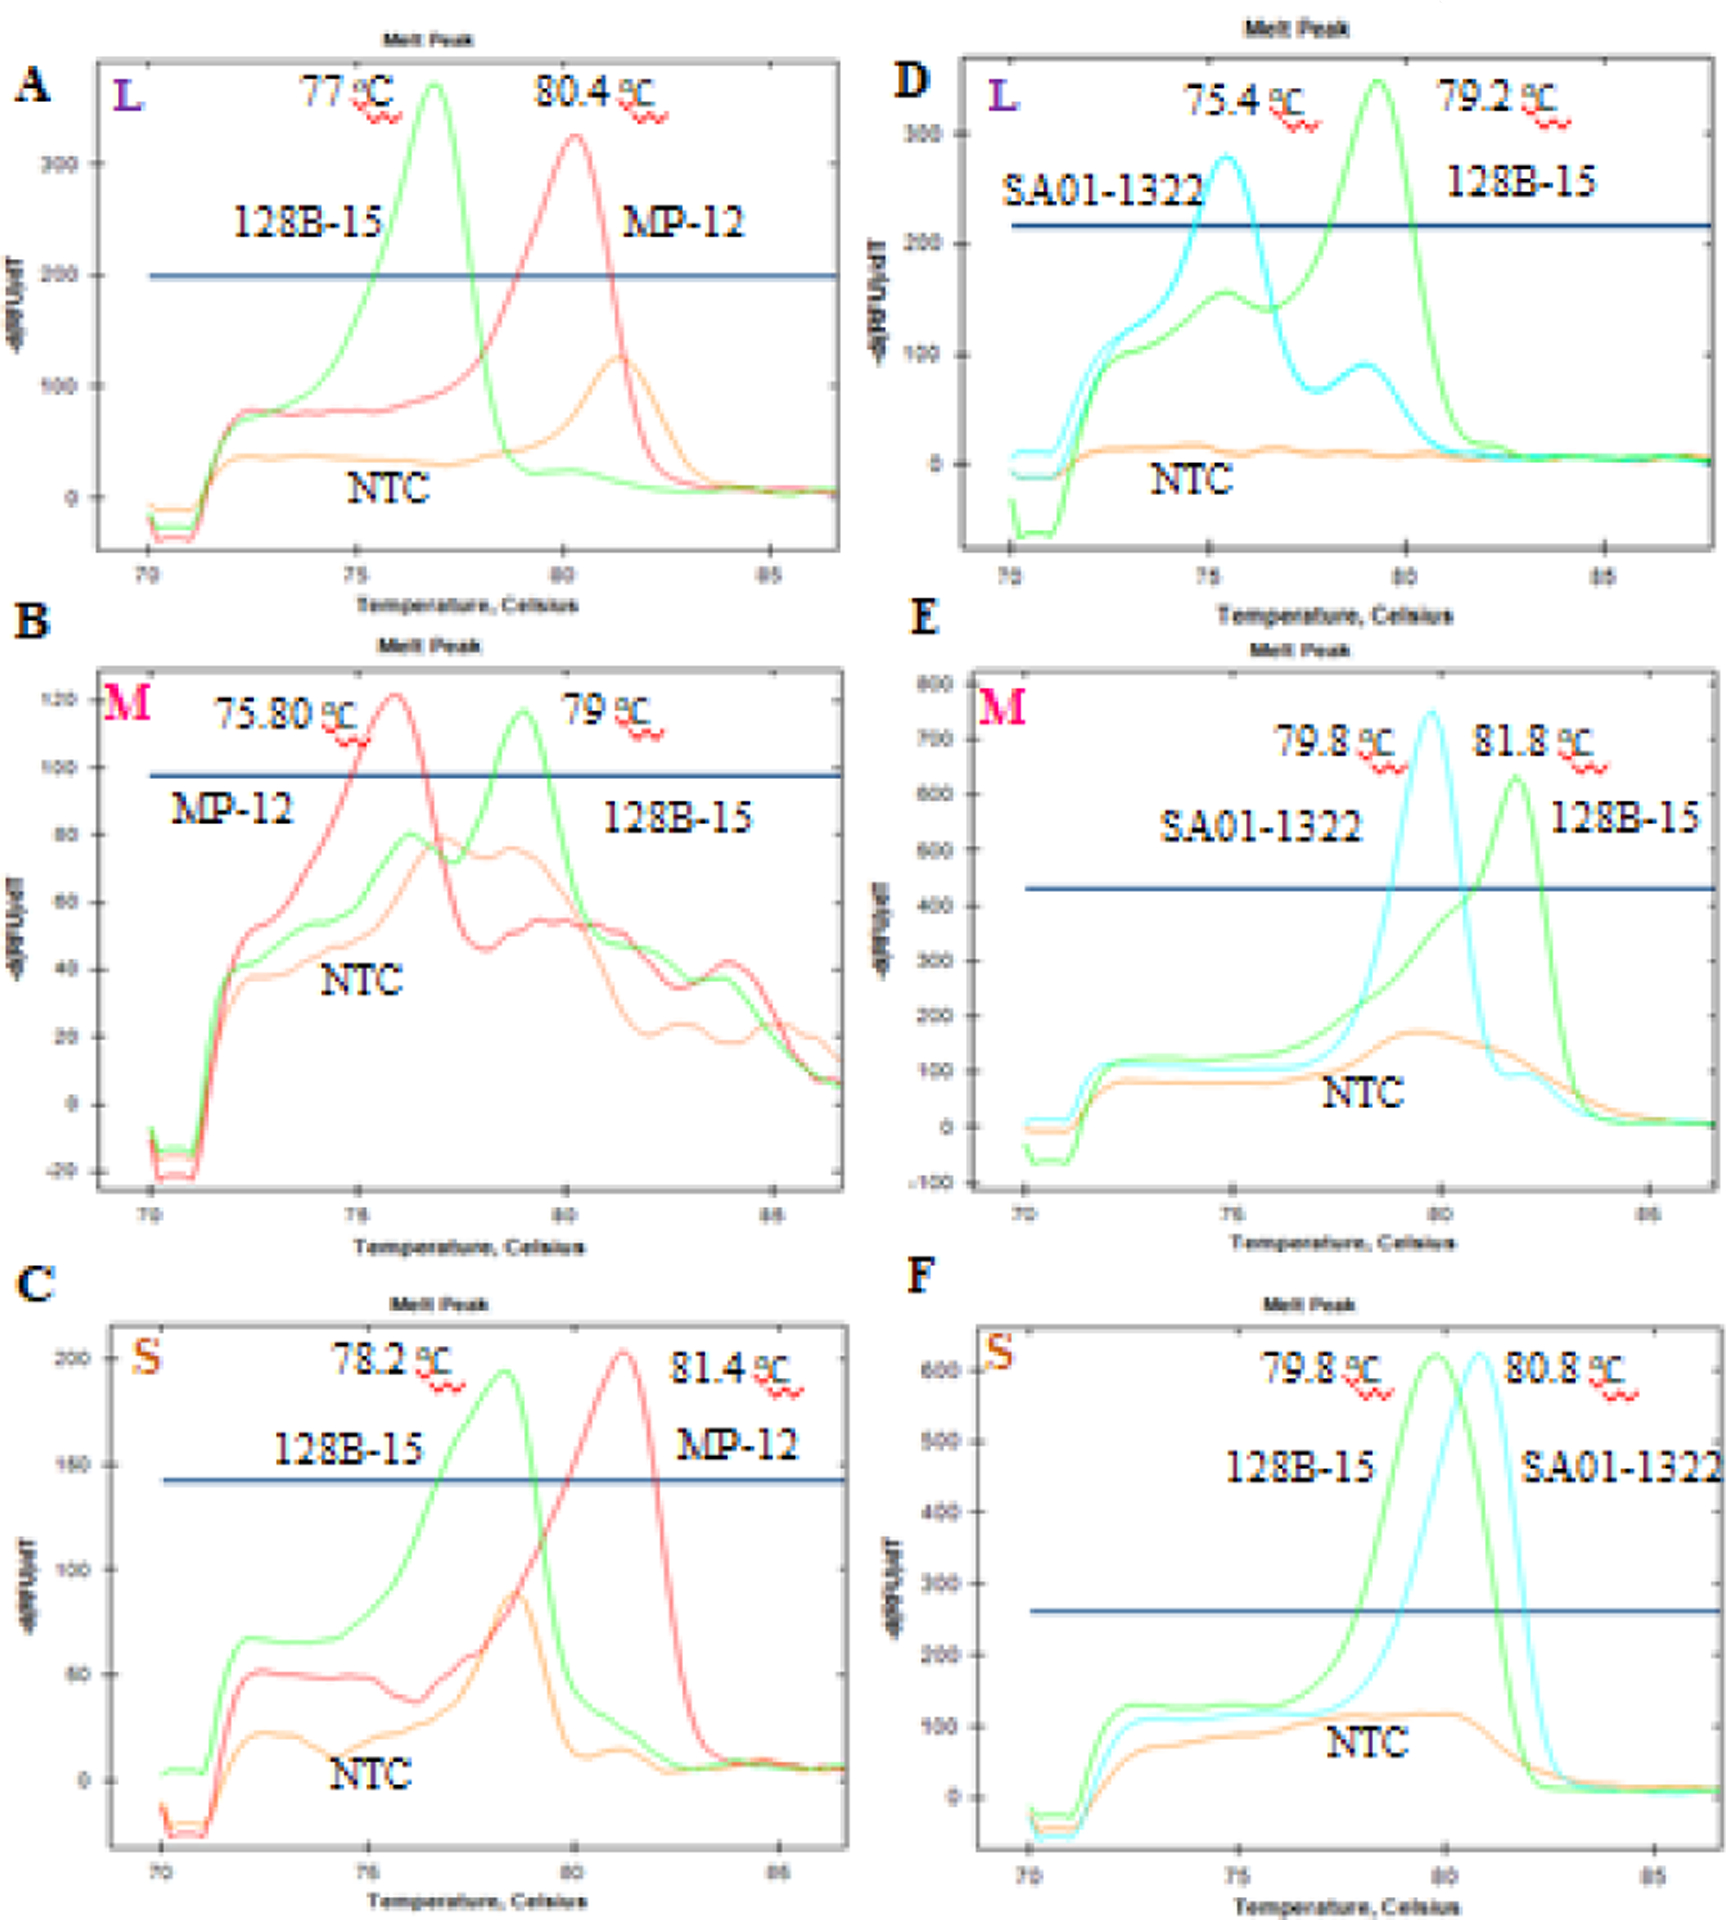
Fig. 1. Results of the RVFV strains RT-qPCR genotyping assays:

Representative melt curves and peak melting temperatures from the PCR amplicons of L, M and S segments of strains 128B-15, MP-12, and SA01–1322, are indicated here. Each melt curve was generated from a single tube PCR reaction with GT assay primers in the presence of a single strain of RVFV viral RNA. Each plot represents the three melt curves generated from three separate tube reactions with respective RVFV strains RNA and no template control (NTC). The left panel (A, B, C) top to bottom was the L, M and S segment genotyping PCR results from 128B-15 and MP-12 strain, and right panel (D, E, F) top to bottom was the L, M and S segment genotyping PCR results from 128B-15 and SA01–1322 strain. Green tracing indicates strain 128B-15, red tracing for strain MP-12 and light blue for SA01–1322 strain.
