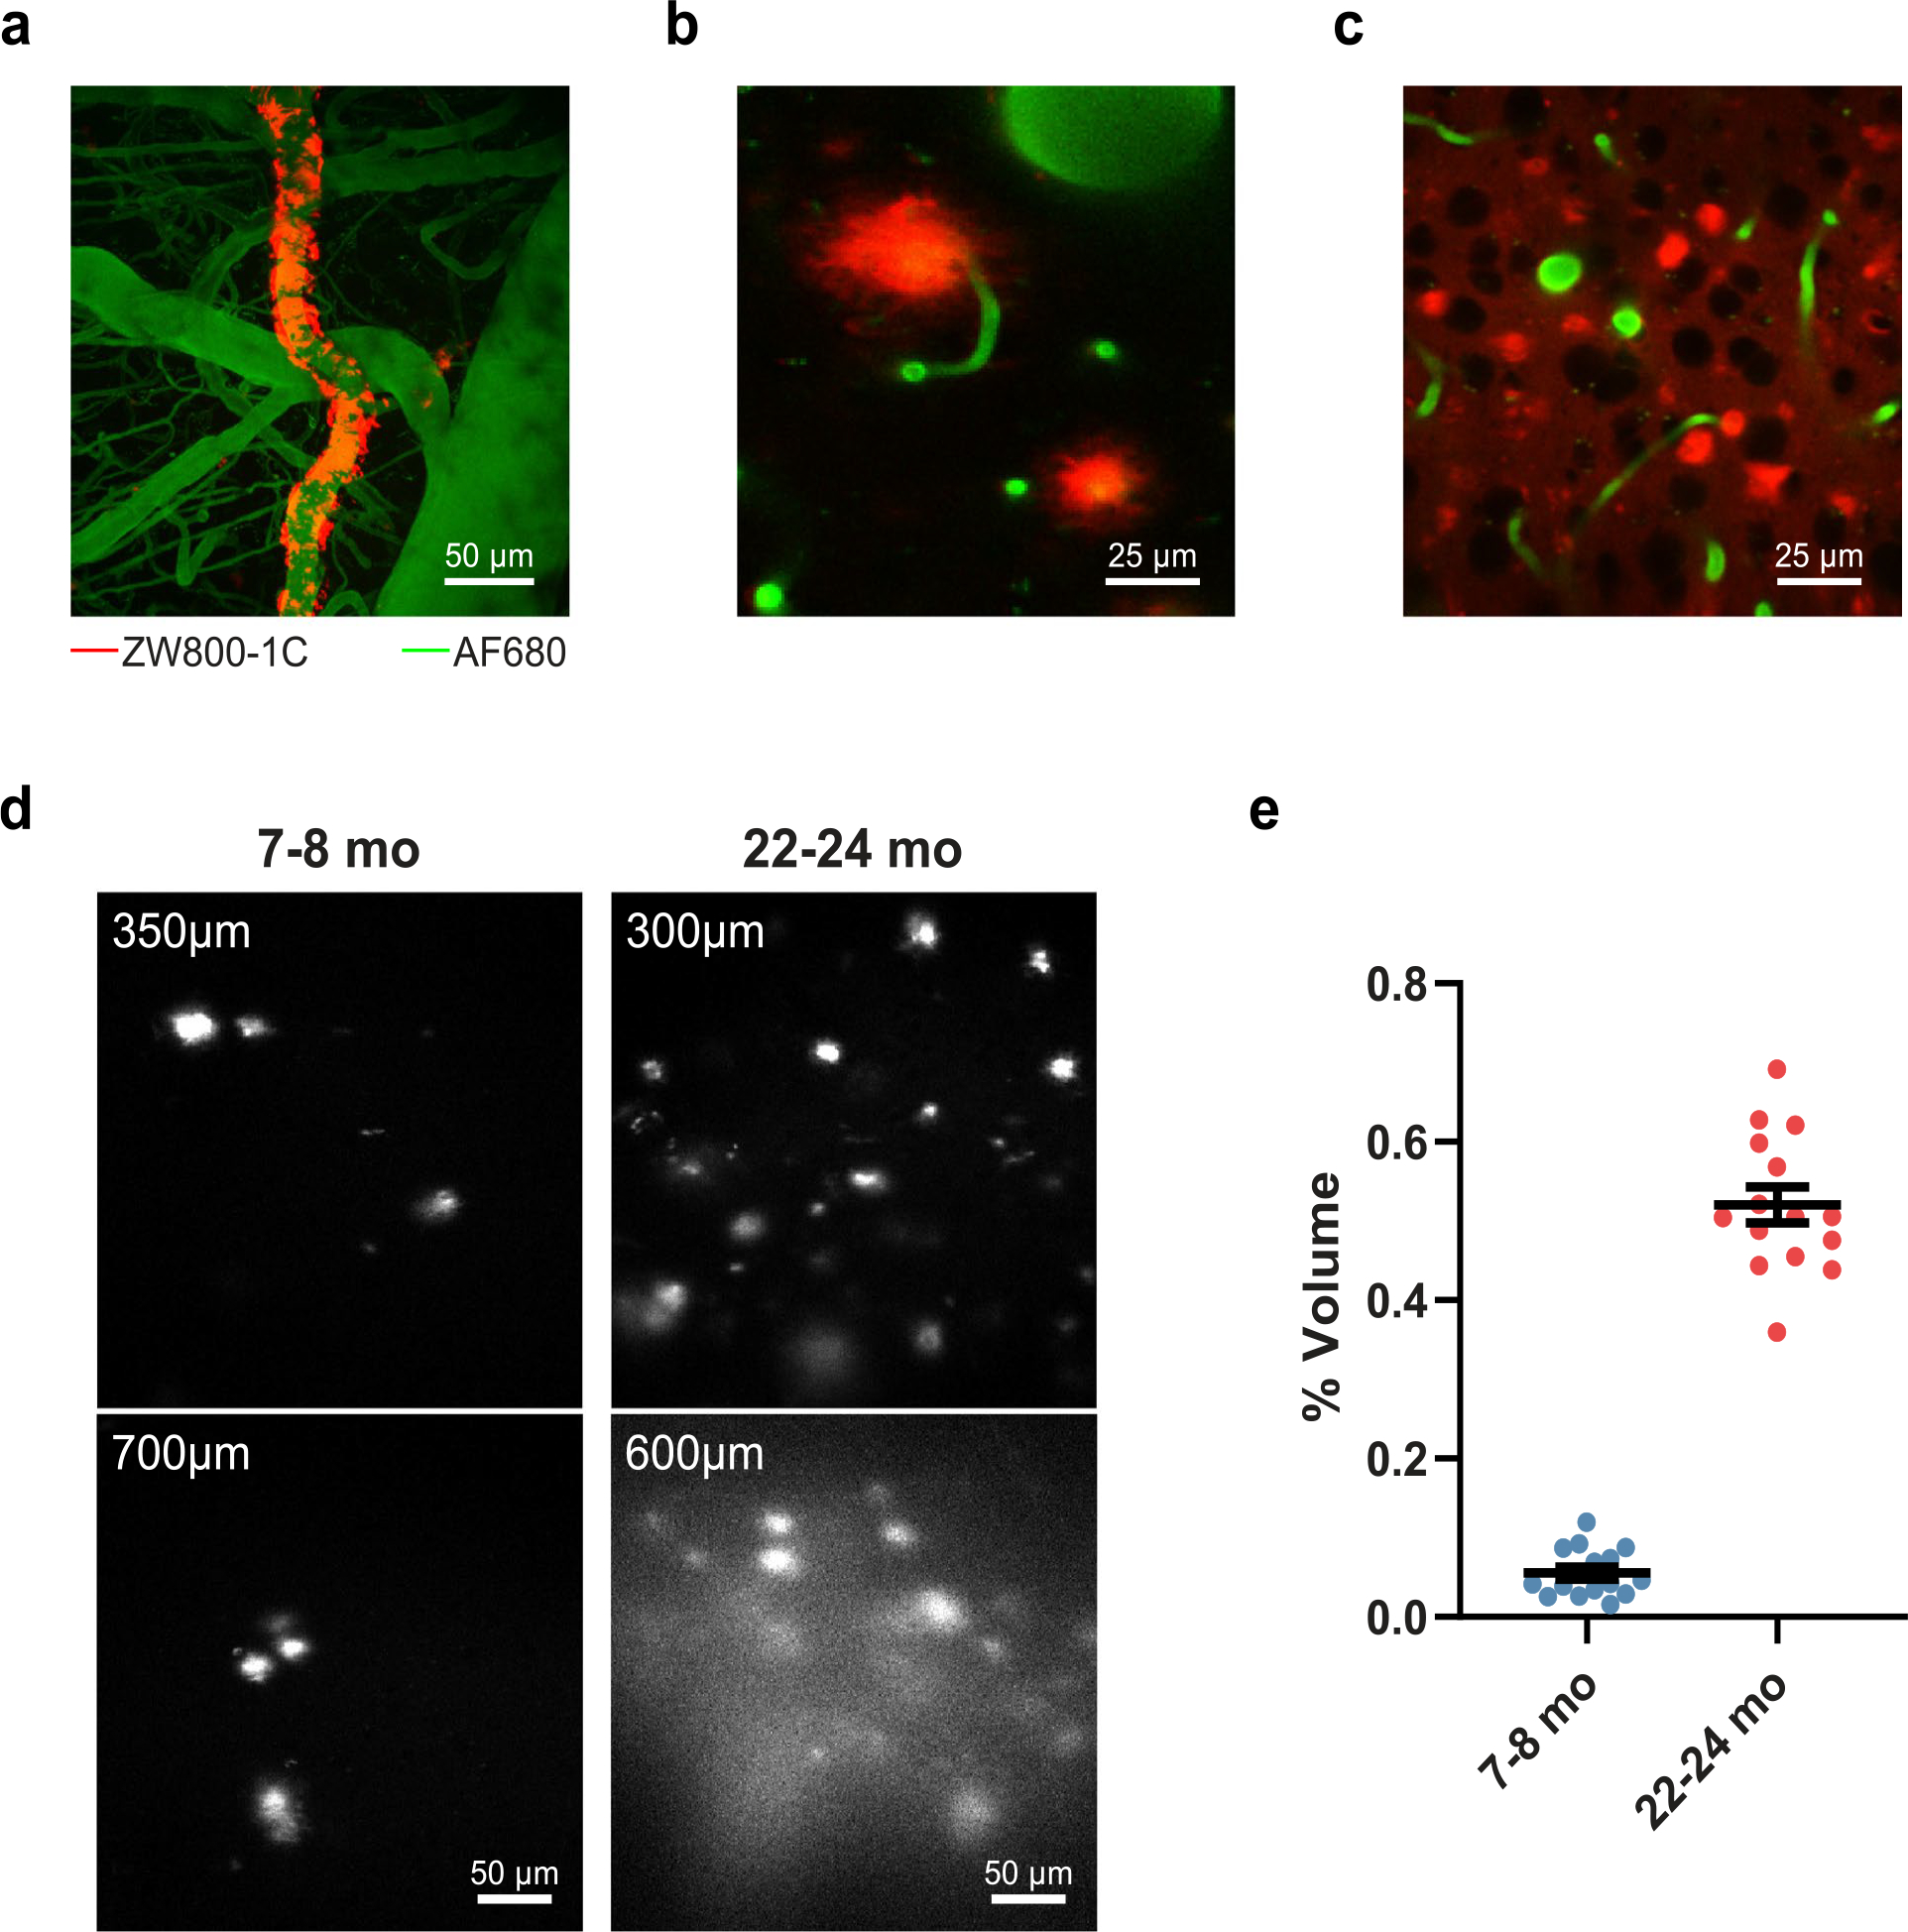
Extended Data Fig. 7 |. Two-photon imaging of ZW800–1C in APP/PS1 and rTg4510 mice.

Two-photon imaging of ZW800–1C (red) with 1,300 nm excitation. Alexa Fluor 680–70 kDa Dextran (green) was systemically injected to create a fluorescent angiogram. Representative images show (a) CAA, (b) amyloid plaques and (c) NFTs from APP/PS1 (n = 3) and rTg4510 (n = 3) mice. (d) Images of amyloid plaques taken at different depths from 7–8 months old (mo) and 22–24 mo APP/PS1 mice. (e) Comparison of the percentage volume occupied by amyloid plaques for 7–8 mo and 22–24 mo APP/PS1 mice (n = 3 mice per age group). Data are shown as mean ± s.e.m.
