
Extended Data Fig. 1 |. Ex vivo labeling intensity of amyloid plaques and CAA by ZW800–1C.
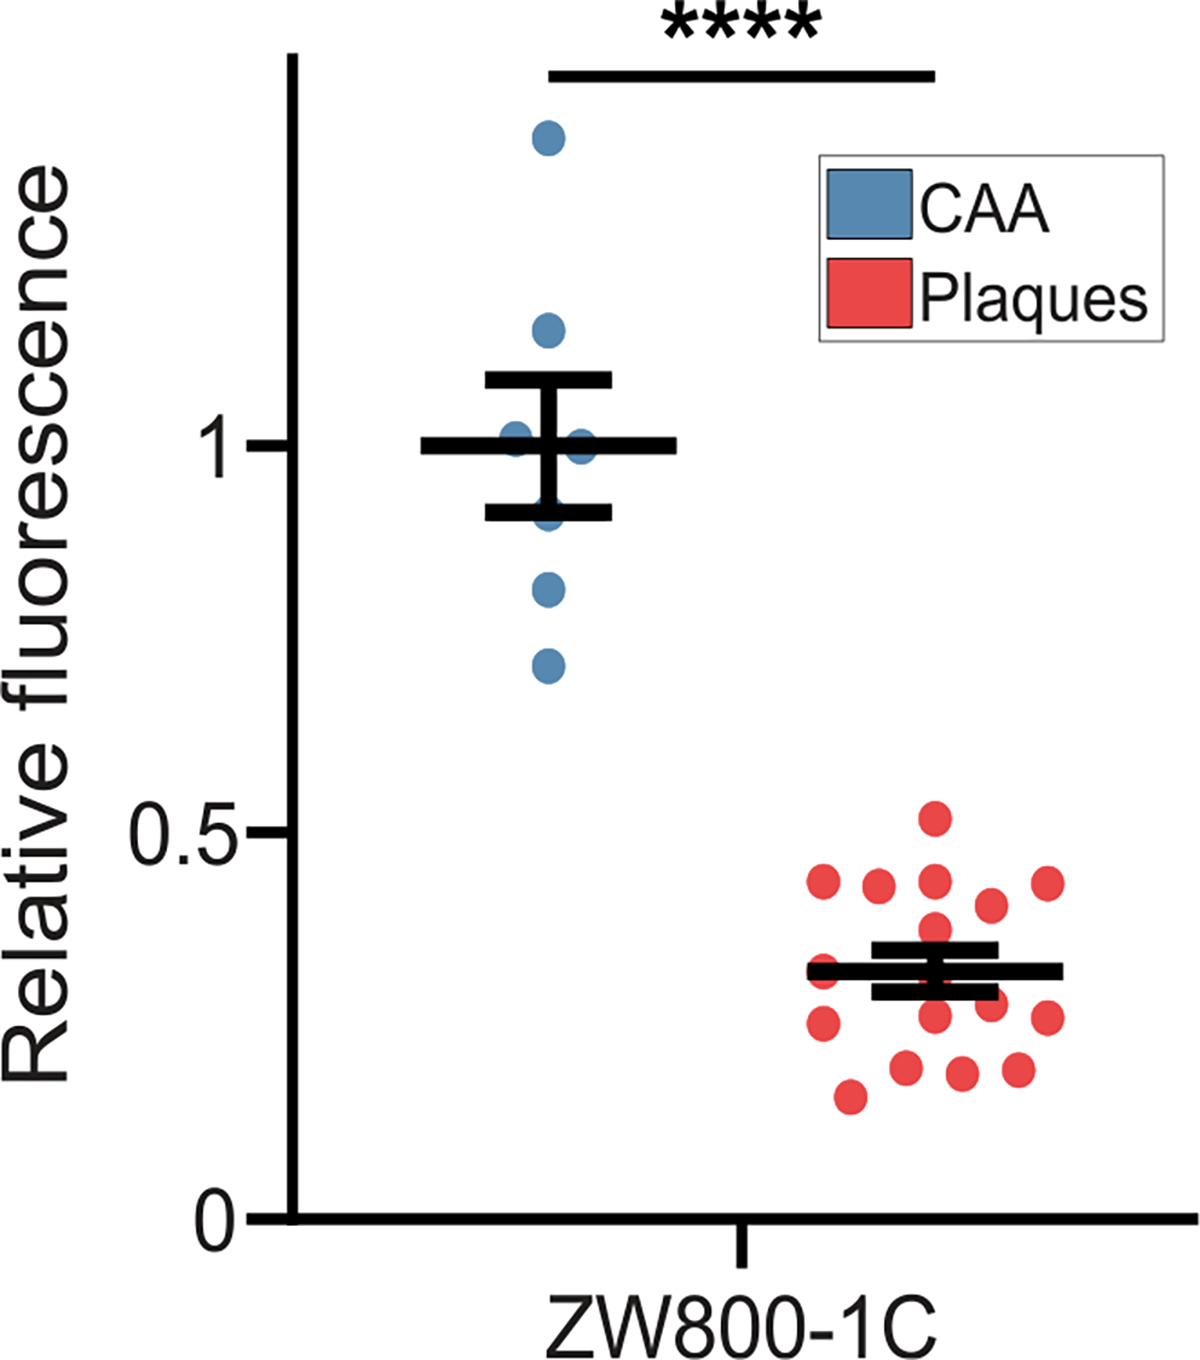
Quantitative comparison of the average labeling intensity of CAA and plaques by ZW800–1C in APP/PS1 brain tissue sections. Sections were stained by incubation in 100 μM ZW800–1C solution in PBS. Significance was calculated using unpaired two-tailed t-test: ****P < 0.0001. Data are shown as mean ± s.e.m.