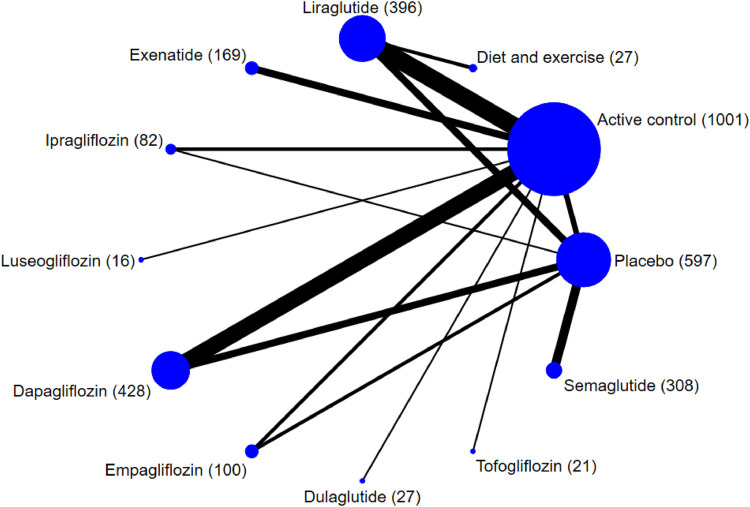
FIGURE 2.
Network plot of trials evaluating the effects of sodium-glucose cotransporter protein-2 inhibitors and glucagon-like peptide-1 receptor agonists for patients with NAFLD. Network shows the number of participants assigned to each treatment class with the size of each circle proportional to the number of randomly assigned participants in the treatment comparisons (sample size for the specific treatment shown in brackets). Line thickness is proportional to the number of patients that contributed to the comparison.

