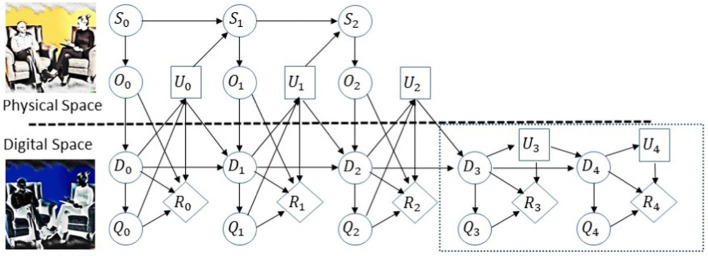
Figure 1.
Probabilistic graphic model for the ADT, adapted from Kapteyn et al. (17). The upper path of the graphical model represents the time evolution of the physical asset states, denoted by S; the lower path represents the time evolution of the digital states, denoted by D. The graphical model encodes the coupling over time between an asset and its DT. At each time point, we measure the physical asset and this information flows into the DT denoted by O. The observational data are used to update the digital states D and the models comprising the DT, which, in turn, are used to predict quantities of interest Q. Then, based on model predictions a decision or control input U is chosen and applied to the physical asset. The above quantities and actions influence the reward denoted by R.

