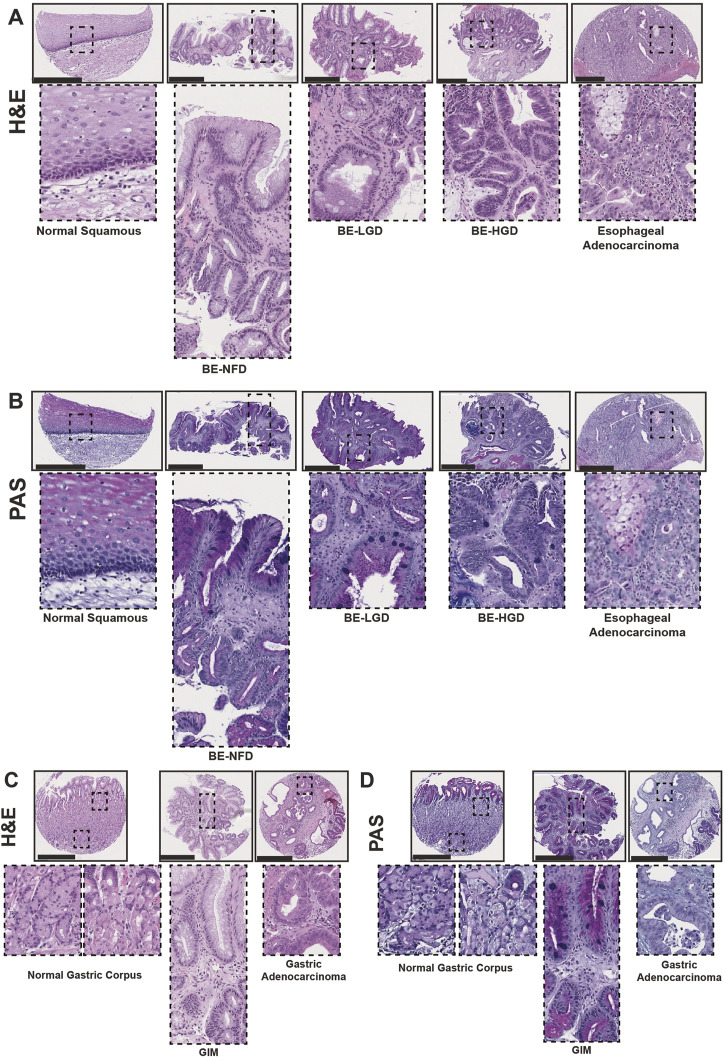
FIGURE 1.
Human tissue microarray of normal squamous-BE-EAC and normal gastric gland-GIM-GA progression sequence. (A) Morphology of representative H&E staining from the human tissue microarray of esophageal cases, from left to right: normal squamous, BE-NFD, BE-LGD, BE-HGD, and EAC. (B) Morphology of representative PAS staining from the human tissue microarray of esophageal cases, same sequence as in (A). (C) Morphology of representative H&E staining from the human tissue microarray of gastric cases, from left to right: normal gastric corpus (left inset from base of the glands, right inset from the surface of the glands), GIM, and GA. (D) Morphology of representative PAS staining from the human tissue microarray of gastric cases, in the same sequence as in (C). All scale bars, 500 μm.

