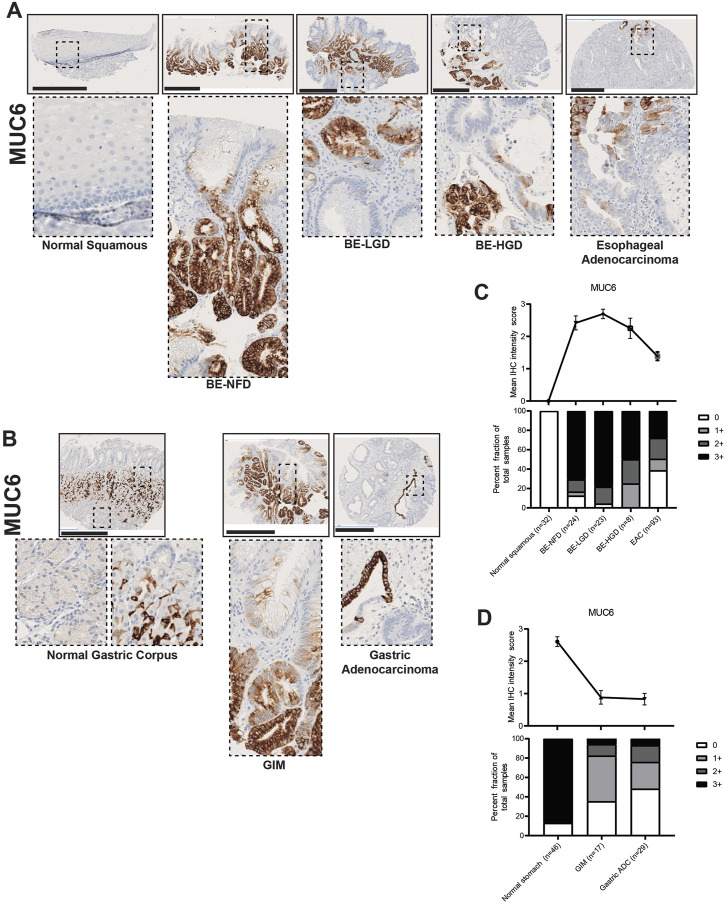
FIGURE 6.
MUC6 expression in normal squamous-BE-EAC and normal gastric gland-GIM-GA progression sequence. (A) Immunohistochemistry of MUC6 staining in human tissue microarray esophageal cases, in the same sequence as in Figure 2A. (B) Immunohistochemistry of MUC6 staining in human tissue microarray gastric cases, in the same sequence as in Figure 2B. All scale bars, 500 μm. (C) Top: the MUC6 average IHC intensity score of each esophageal phenotype is plotted in the same sequence as in Figure 2C. Bottom: the MUC6 fraction of esophageal tissue cores with each score is plotted in the same sequence as in Figure 2C. Each phenotype’s total tissue core number is provided at the bottom of each column. (D) Top: the MUC6 average IHC intensity score of each esophageal phenotype is plotted in the same sequence as in Figure 2D. Bottom: the MUC6 fraction of esophageal tissue cores with each score is plotted in the same sequence as in Figure 2D. Each phenotype’s total tissue core number is provided at the bottom of each column.

