Figure 4.
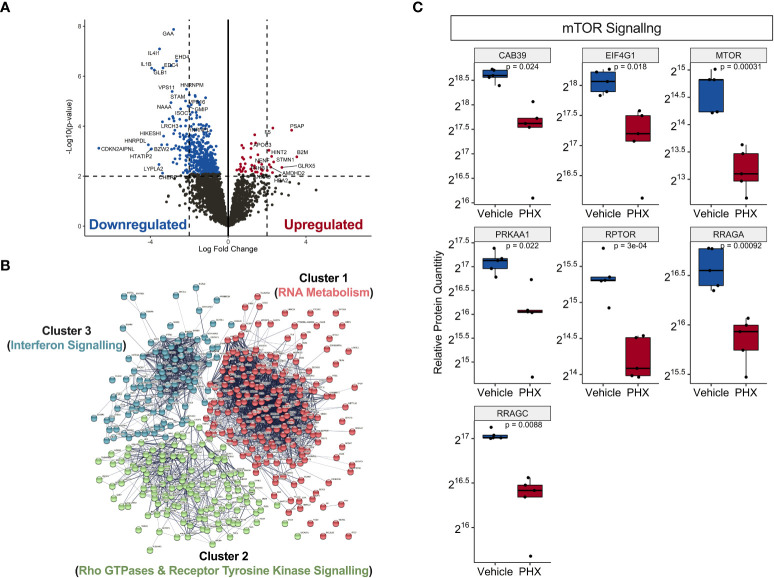
Proteomic analysis on PHX treated M1 macrophages reveal downregulation in immune signalling and RNA metabolism. (A) Volcano plot showing statistically significant upregulated (red) and downregulated (blue) proteins in 5 μM PHX treated M1 macrophages. (B) Network analysis based on protein-protein interactions (PPI) of 433 significantly downregulated proteins in PHX treated M1 macrophages. The k-means clustering identified 3 clusters with distinct Reactome Knwoledgbase pathway associated proteins. (C) Box plot comparing relative protein expression of identified mTOR signalling proteins between vehicle or PHX treated M1 macrophages. Student’s unpaired t-tests.

