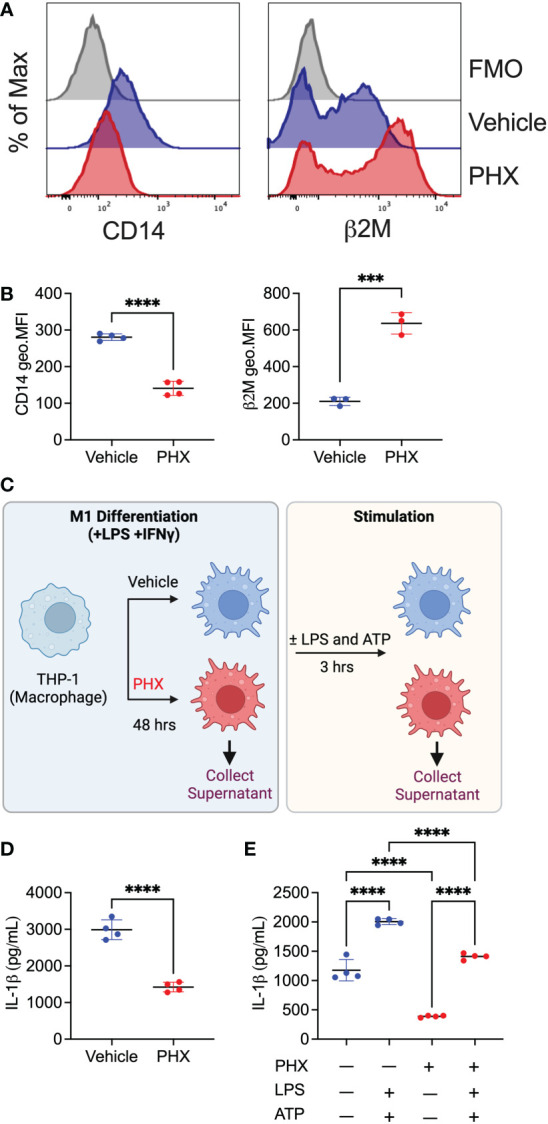
Figure 7.

Validation of proteomics data set. THP-1 derived M1 macrophages cultured with 5 μM PHX or vehicle control were examined for changes in expression of proteins by flow cytometry or ELISA. (A) Histogram plots and (B) quantitation of geometric mean fluorescence intensity (geo.MFI) for the expression of CD14 and β2M on CD80+ macrophages. (C) Experimental workflow describing the collection of supernatants for IL-1β detection. Supernatants (D) prior to stimulation or (E) after stimulation with LPS and ATP was collected from PHX-treated M1 macrophages. Data are pooled 3-4 replicates and presented as mean ± SD. Student’s t-test or One-way ANOVA with Dunnett's multiple comparisons test was performed for the analysis. ***p ≤ 0.001; ****p ≤ 0.0001.
