Figure 2.
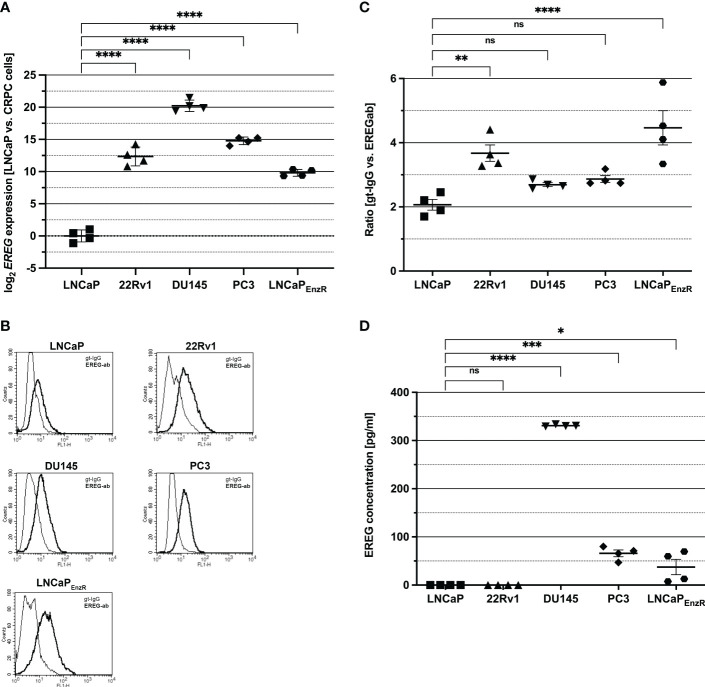
EREG expression and secretion is higher in CRPC in comparison to LNCaP cells (CSPC). (A) The expression of EREG after ADT treatment was assumed to be increased according to preliminary data. Analysis of EREG expression using qRT-PCR show an increased (p < 0.0001) EREG expression in CRPC cells in comparison to castration sensitive LNCaP cells. (B) Flow cytometry analysis shows the presence of EREG (dark) on the cell surface of CSPC and CRPC cell lines. Goat-IgG (light) is used as a control. Histograms show representative flow cytometry results for CSPC and CRPC cell lines using EREG antibody and goat-IgG. (C) The ratio is determined from the mean of the fluorescence intensity of the sample compared to the control. EREG protein on cell surface of 22Rv1 (p=0.0043) and LNCaPEnzR (p < 0.0001) cells is significantly increased in comparison to CSPC cells whereas EREG protein on DU145 (p=0.55) and PC3 (p=0.29) is slightly, but not significant increased compared to CSPC cells. (D) PCa cell culture supernatant was collected and EREG protein was investigated by sandwich ELISA. Whereas LNCaP and 22Rv1 cells secrete no EREG protein, it was detected in DU145 (330 pg/ml), PC3 (66 pg/ml) and LNCaPEnzR (37 pg/ml) supernatant. All graphs show the mean and SD from four independently performed experiments (ns, not significant; *p < 0.05; **p < 0.01; ***p < 0.001; ****p < 0.0001).

