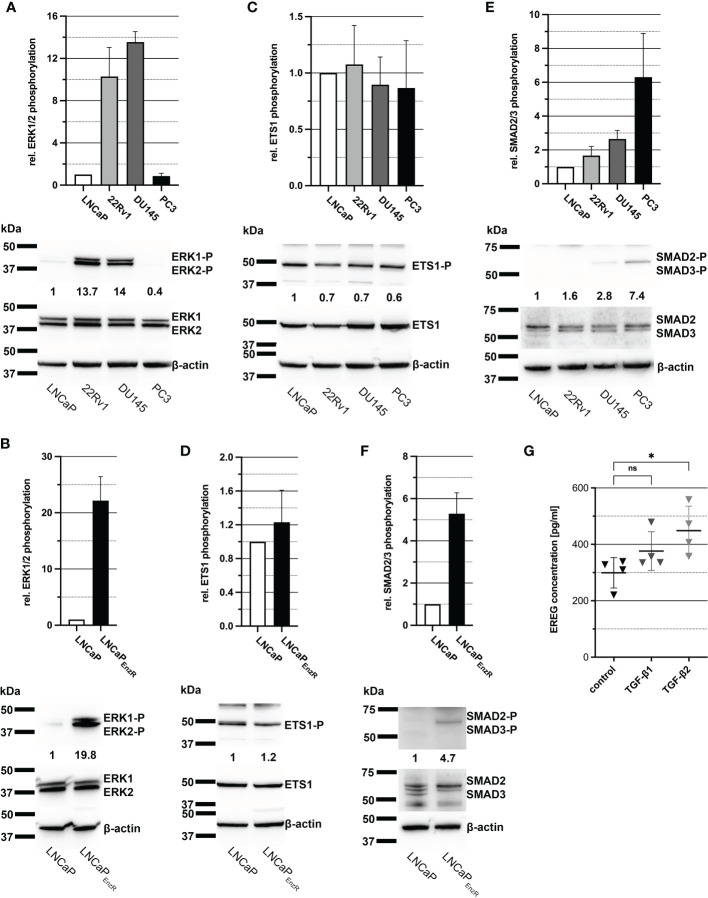
Figure 4.
Elevated phosphorylation of SMAD2/3 seems to enhance EREG expression in PCa cells. (A) Column graph shows ERK1/2 phosphorylation at Thr202/Tyr204 in PCa cell lines LNCaP, 22Rv1, DU145 and PC3. ERK1/2 phosphorylation in 22Rv1 and DU145 cells are increased in comparison to LNCaP cells. Additionally, a representative immunoblot image for ERK1/2 phosphorylation in PCa cell lines is illustrated. (B) ERK1/2 phosphorylation at Thr202/Tyr204 of LNCaP in comparison to LNCaPEnzR cells and a representative immunoblot image are shown. Phosphorylation of ERK1/2 is enhanced in LNCaPEnzR cells. (C) The column graph shows the phosphorylation of transcription factor ETS1 at Thr38 in the different PCa cell lines without differences in ETS1 phosphorylation and expression. The adjacent representative immunoblot illustrates the result. (D) As revealed in the graph and the representative immunoblot, LNCaPEnzR exhibit no alteration in ETS1 phosphorylation at Thr38 compared with the parental LNCaP cells as well. (E) The bar graph and representative immunoblots shows the phosphorylation of transcription factor SMAD2/3 at Ser465, Ser467, Ser423, Ser425 in PCa cell lines. Compared to LNCaP cells, SMAD2/3 phosphorylation in 22Rv1 and DU145 is slightly increased, but PC3 cells show a noticeably higher phosphorylation of SMAD2/3. (F) SMAD2/3 phosphorylation of LNCaPEnzR cells is illustrated in a column graph and a representative immunoblot image. Phosphorylation in SMAD2/3 at Ser465, Ser467, Ser423, Ser425 is increased in LNCaPEnzR in comparison to parental LNCaP cells. All graphs show the mean and SD from four independently performed experiments. (G) Total EREG protein in cell culture supernatant of DU145 cells after TGF-β1 (p=0.2649) or TGF-β2 (p=0.0283) treatment is significantly elevated in comparison to untreated DU145 cells. All graphs show the mean and SD from four independent experiments (ns, not significant; *p < 0.05).

