Figure 5.
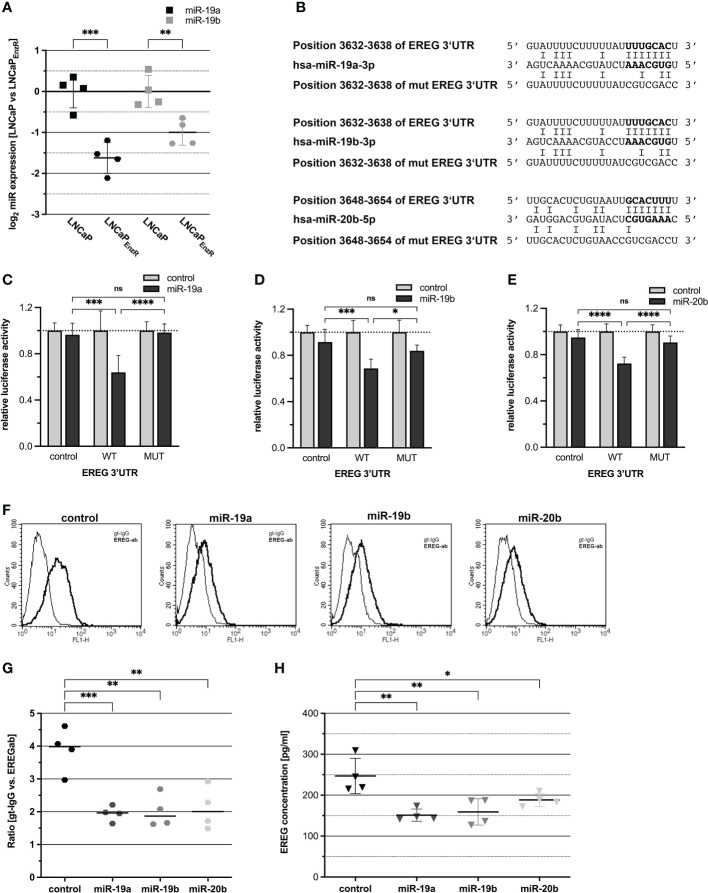
EREG protein biosynthesis is post-transcriptionally regulated by miRNAs. (A) The expression of miR-19a and -19b that were assumed to be reduced according to preliminary data was assessed by qRT-PCR. MiR-19a (p=0.0001) and -19b (p=0.0053) were significantly reduced in LNCaPEnzR compared to parental LNCaP cells. (B) Predicted miRNA binding sites in the 3’UTR of EREG mRNA for miR-19a, -19b, -20b and the mutated miRNA binding sites are shown. The bold nucleotides in the sequences represent the miRNAs seed sequence and its corresponding binding sites. (C–E) For luciferase reporter assay, miRNA expression plasmids (control grey bar, miRNA black bar) were cotransfected with empty reporter plasmid (control), reporter gene construct containing wildtype EREG 3’UTR (WT) or reporter gene construct containing mutated EREG 3’UTR (MUT). The luciferase activity of the reporter gene plasmid coexpressed with control expression plasmid was set to 1. MiR-19a (p=0.0001), -19b (p=0.0006) and -20b (p<0.0001) significantly reduce luciferase activity of the reporter gene construct containing EREG 3’UTR in comparison to the control. After mutation of the seed sequence, the corresponding miRNAs are not able to reduce the luciferase activity. (F) Flow cytometry analysis using EREG antibody show the EREG presence on the cell surface of LNCaPEnzR cells transfected with miRNA expression plasmid. The histograms show representative flow cytometry analyses of LNCaPEnzR cells transfected with miRNA expression plasmid using EREG antibody (dark) and goat-IgG (light). (G) The ratio is determined from the mean of the fluorescence intensity of the specific EREG antibody compared to the control (goat-IgG). EREG protein on cell surface of LNCaPEnzR cells transfected with expression plasmids for miR-19a (p=0.0008), miR-19b (p=0.001) or miR-20b (p=0.0015) is significantly decreased in comparison to LNCaPEnzR cells transfected with control expression plasmid. All graphs show the mean and SD from four independent experiments (ns not significant; *p < 0.05; **p < 0.01; ***p < 0.001; ****p < 0.0001). (H) Total EREG protein in cell culture supernatant of DU145 cells transfected with expression plasmids for miR-19a (p=0.0015), miR-19b (p=0.0029) or miR-20b (p=0.038) is significantly decreased in comparison to DU145 cells transfected with control expression plasmid. All graphs show the mean and SD from four independent experiments (ns, not significant; *p < 0.05; **p < 0.01).

