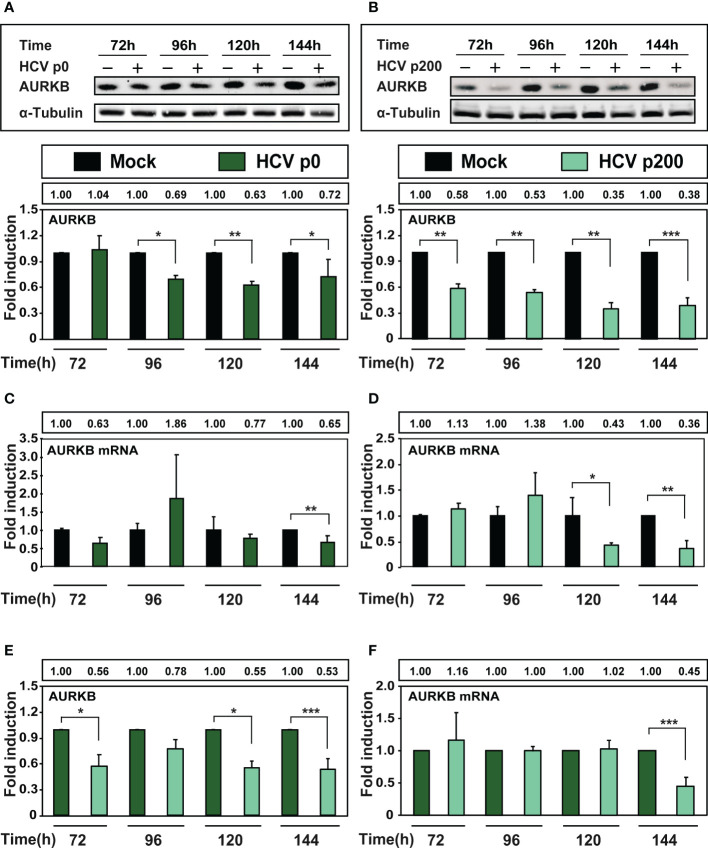
Figure 4.
Effect of HCV infection on AURKB expression. Huh-7.5 reporter cells were either mock-infected or infected with HCV p0 and HCV p200 at a MOI of 0.03 TCID50/cell. (A) Western blot with extracts of cells infected with HCV p0. Bands correspond to the cellular AURKB and α-tubulin used as loading control. The lower panel shows the densitometry quantification of the bands, taking as reference the corresponding value for mock-infected cells, numerical values are given in the box above the lower panel. Times post-infection are indicated in abscissa. (B) Same as A but for HCV p200-infected cells. (C, D) RT-qPCR measurements of AURKB mRNA using GADPH gene as control. (E, F) Same as A-D but with the AURKB and AURKB mRNA levels in HCV-infected cells expressed as the fold induction relative to the corresponding value for the HCV p0 infected cells. Results are the average of three independent experiments (biological triplicate). Asterisks indicate statistical significance as follows: *p<0.05; **p<0.01; ***p<0.001; unpaired t-test.

